

Impact of Dietary Fiber on Soft Drinks with Varied Sweeteners

Enrique José Salazar Llorente 1*, Fernando Javier Cobos Mora 2, Iván Patricio Viteri García 3, Genesis del Rocío Bucaram Lara 4
1 Facultad de Ciencias Agropecuarias, Universidad Técnica de Babahoyo, Km 7.5 Vía Babahoyo
- Montalvo.
2 Facultad de Ciencias Agropecuarias, Universidad Técnica de Babahoyo, Km 7.5 Vía Babahoyo
- Montalvo; fcobos@utb.edu.ec.
3 Facultad de Ingeniería Química, Universidad de Guayaquil, Av. Delta s/n y Av. Kennedy Guayaquil, Guayas, Ecuador; iviteri@utb.edu.ec.
4 Facultad de Ciencias Agrarias, Universidad Agraria del Ecuador, Vía Puerto Marítimo - Av. 25 de Julio y Pío Jaramillo, Guayaquil, Guayas, Ecuador; Glaraguerrero@hotmail.com.
* Correspondence: ejsalazar@utb.edu.ec; Tel.: +(593) 98 712 8999; +(593) 42 85 0747.
ABSTRACT
In the present work, the characteristics of the effect of dietary fiber in two types of soft drinks were compared, considering beverages with low and high sucrose content, using a 22 experiment design for the independent variables amount of dietary fiber and sucrose content. The dependent variable was the percentage of soluble solids, and experimental runs were carried out to establish the stability of the product during the process. The design mentioned above determined significant differences in physicochemical parameters, such as increased fiber percentage and sucrose amount in final brix degrees. Samples of the Beverage were taken during processing and evaluated over time to establish the behavior of soluble solids, density, and the amount of fiber during the pasteurization process, which was determined at 85ºC for 120 seconds. The behavior of the un-pasteurized soft drink was also studied at refrigeration temperature for one day in samples with sucrose and partially substituted with sucralose, enriched with dietary fiber and without its addition, to evaluate and analyze if the thermal effect determines a significant difference in the quality of the finished product. The laboratory analyses were based on a quantitative, enzymatic-gravimetric analysis of dietary fiber and soluble solids. The best option was chosen considering the best variety of soft drinks with low sucrose content and enriched with dietary fiber, increasing the beverage's nutritional value. This selection was implemented in a soft drink factory, and the procedure was standardized at the industrial level. The development of this research contributed to technological improvements reflected in the product's final price, minimizing costs and highlighting that with a minimum investment, it is competitive. The results of the tests performed on the carbonated beverage to determine the response variables were statistically analyzed using STATGRAPHICS software. The triplicate results of each trial were initially evaluated for significant differences attributable to the treatments, and the validity of the data was verified by analysis of their distributions, considering a relative error of less than 10%. Finally, current computer programs automatically calculate the p-value, and for the interpretation of the various results, this calculated value is compared with a pre-established confidence level, which generally is 95%.
Keywords: increased fiber; soluble solids; sucralose; sucrose.
INTRODUCTION
Current lifestyles are causing changes in eating habits, leading to more and more products with high nutritional characteristics that are easy to prepare and consume. In these processed products, nutritional and some sensory properties are essential as quality attributes that encourage consumer interest and contribute to product acceptance1 .
As alternatives to sucrose, the food industry has developed a set of artificial sweeteners, including sucralose. Artificial sweeteners are currently one of the most dynamic areas within the field of food additives due to the significant expansion that the market for low-calorie products is experiencing. As sucralose is not metabolized for energy, it does not provide calories. It passes quickly through the body virtually unchanged, is not affected by the digestive process and does not accumulate in the body. By replacing sucrose with sucralose in beverages, calories can be reduced or, in many products, virtually eliminated 1 .
Sucralose provides the sweet taste of sugar and the necessary heat, liquid, and storage stability for incorporation into various food and beverage applications. It maintains exceptional stability in acidic products, such as non-carbonated soft drinks and other liquid-based products. Samples of the soft drink were prepared in concentrations of 1.5% dietary fiber in 100% sucrose-based beverages and partially substituted sucralose with 40% sucralose, which were stored at room temperature in the city of Guayaquil, which averages 32ºC for 4 months. The experimental results were adjusted to a model of an increase in fiber content, a decrease in caloric content during that time and variation in the density of the beverage due to the increase in solids 1 .
Some industries produce non-carbonated soft drinks, bottled water, natural juices, packaged juices, powdered juices, milk, yogurt, coffee, tea, and energizers, among others 1 .
Emulsions can vary considerably in their physical characteristics depending primarily on the particle or globule size of the internal or dispersed phase. These can range from 0.25 to 25 micrometers in diameter. When the particles are more significant than 5 micrometers, the emulsion is considered low quality; below this number, they are considered fine good quality 1 .
The emulsions are highly stable because their particular manufacturing process ensures oil particles smaller than 0.5 microns, avoiding phase separation 2 and the usual necks generated in beverages using essential oils or poor-quality emulsions.
Likewise, asthmatic persons may also experience symptoms after consumption of this additive, as it is known to act as a histamine-releasing agent 2 .
The maximum daily intake is 7.5 mg/kg body weight 3 . Tartrazine is mainly composed of trisodium 5-hydroxy-1-(4-sulfonatophenyl)-4-(4-sulfonatophenylazo)- H-pyrazole-3-carboxylate and additional secondary colorants. It also contains sodium chloride and sodium sulfate as its primary colorless constituents. In the beverage industry, there is more awareness of the benefits of using acidulants.
Flavor profiles can be enhanced or improved through the use of certain acidulants. Furthermore, mathematical models can be employed to estimate the acidity sensation of acidulants or blends of acidulants. Citric acid and ascorbic acid were utilized as acidulants for the product discussed in this study. 4.
The required daily doses of vitamin C are not precisely defined; however, the Food and Drug Administration of the United States proves that 60 mg/day maintains a body total of one and a half grams, which is enough to meet the body's demands for one month. Accordingly, the consumption of citric fruit per day fulfills such requirements 5.
Granofiber T800 fiber will be incorporated into creating the refreshing drink. This soluble dietary fiber is derived from partially hydrolyzed guar gum. It is a versatile powder that can be effortlessly mixed into various foods and beverages 5.
Granofiber T800 does not affect the flavor, color, texture, or aroma of the products it adds to. It provides a convenient method of increasing fiber intake in people's diets through their preferred foods and beverages. Its solubility is attributed to guar gum, a water-soluble carbohydrate from guar plant seeds. In the food industry, guar gum is valued for its thickening, gelling, emulsifying, and stabilizing properties due to its high viscosity 5.
Sucralose's exceptional taste is revolutionizing the way consumers perceive sweetness. It is approximately 600 times sweeter than sucrose, nearly twice as sweet as saccharin, and 3.3 times sweeter than aspartame. Sucralose is produced through the selective halogenation of sucrose, where the molecule's three hydroxyl groups are replaced with chlorine, resulting in 4-chloro-deoxy to D-galactopyranoside of 1,6-dichloro- 1,6-dideoxy- β-D-fructofuranosyl 6.
Unlike other sweeteners, sucralose retains its sugar taste after being added to foods and beverages. As a result, it is possible to improve existing foods and beverages, create new products and revolutionize consumer preferences. In addition, sucralose has no calories and does not cause tooth decay 6.
Sucralose is thermostable and resists pH variations. Many products sweetened entirely with sugar can be reformulated with this sweetener to optimize their caloric content and maintain the flavor profile. The acceptance of sucralose among consumers is a proven fact. Unlike other sweeteners, sucralose retains its sugar taste after incorporation into foods and beverages. As a result, not only can existing foods and beverages be improved, new products can also be created, and consumer preferences can be revolutionized. In addition, sucralose is calorie-free and does not cause tooth decay 6.
Xanthan gum is stable over a wide acid range, is cold and hot soluble and resists freezing and thawing processes very well. It is added to foods to control the rheology of the final product. The polymer dramatically affects properties such as texture, aroma release and appearance, contributing to the product's acceptability for consumption. Because of its pseudoplastic character in solution, xanthan gum has a less rubbery mouthfeel than gums with Newtonian behavior. Its behavior as an antioxidant is greater than that of other polysaccharides due to its outstanding capacity to bind metals 6.
Dietary fiber can be obtained from a wide variety of natural foods such as whole grain cereals, legumes, fruits and vegetables or processed fiber-rich products that may differ from their natural state but are more accessible or convenient 7.
Hemicellulose, with this name, refers to a series of molecules formed by polymers of hexoses and pentoses, which are closely associated with cellulose (hence the name hemicellulose). Among the best known are the polymers called xyloglucans, arabinogalactans and rhamnogalacturonans, whose main monosaccharides are xylose and glucose, arabinose and galactose and, in the last case, rhamnose and galacturonic acid. They are found in whole grains and vegetables in general 8.
Sweeteners correspond to chemical agents synthesized in laboratories, which provide a sweet taste to food and have pleasant sensory properties for most individuals. Sweet taste has always been associated with positive characteristics, including the manifestation of emotions of affection and reward 9.
Nutritive or Caloric Sweeteners provide sweetness and volume to the food they have been added to. They also provide freshness and contribute to the quality of the product. They are found in the form of table sweeteners (fructose), in foods, beverages and drugs (fructose, corn syrup) and in chewing gum and candies (polyols). Among the best-known are fructose, sorbitol, lactose, barley malt syrup, residual molasses, brown rice syrup, date sugars, whole cane sugar evaporate, honey, maple syrup, stevia, glucose, polydextrose, xylitol, lactitol, maltose, mannitol 10.
The main objective of the research is to evaluate the effect of dietary fiber on the composition of two beverages with different types of sweeteners. The aim is to analyze how adding dietary fiber can influence the physicochemical and sensory characteristics of the beverages, compared to versions without fiber. In addition, we seek to determine whether dietary fiber affects the stability of the beverages over time, especially in terms of changes in sugar content and other vital components.
One of the research's key hypotheses is that adding dietary fiber to beverages will modify their physicochemical properties, such as viscosity, stability and texture. Dietary fiber is expected to act as a thickening and stabilizing agent, which could significantly impact the sensory perception of the beverages, especially their consistency and palatability. It is also hypothesized that dietary fiber could interact differently with the different sweeteners used in the beverages, resulting in different changes in the final composition.
Another hypothesis to explore is whether adding dietary fiber can affect the bioavailability of sweeteners and other nutrients in beverages. It is proposed that dietary fiber could influence the absorption and metabolism of sweeteners, which could affect the glycemic response and satiety perceived by consumers. In addition, dietary fiber is expected to affect the microbiological stability of beverages, which could influence their shelf life and safety for consumption.
MATERIALS AND METHODS
This work was developed by the company Resgasa, located at km 6.5 via Daule in Guayaquil. Among the wide range of juices produced by the company, the refreshing drink commercially called All-Natural Lemonade was chosen because, according to statistics from the Sales Department, it represents 30% of the total monthly turnover, being a product of high rotation and demand.
According to preliminary tests in which the curves of dietary fiber added to the product were determined in a stainless-steel formulation tank, 1 500 L. of Beverage was prepared in three separate batches of 500 L. each, to which the dietary fiber was added at concentrations of 1.5% respectively and evaluated in beverages with sucrose and partially substituted with sucralose at 40%, then the beverage was pasteurized at 85ºC, with a retention time of 2 minutes. The tests were carried out for 4 months in the beverage industry.
All the samples of beverages with sucrose and those partially substituted with 40% sucralose, with fiber and without dietary fiber, were kept in an oven at 32ºC for 4 months.
The response variables were statically analyzed using the STATGRAPHICS program. The triplicate results of each trial were initially evaluated for significant differences attributable to the treatments, and the validity of the data was checked by analyzing their distributions, considering a relative error of less than 10%. Finally, current computer programs automatically calculate the p-value and, to interpret the different results, this calculated value is compared with a pre-established confidence level of 95%.
Experiment Design to Evaluate the Effect of Fiber in Soft Drinks.
The variables studied were the dietary fiber content and the addition of sucralose for the beverage industry. This directly affects the density-fiber ratio by maintaining the same pasteurization temperature and taking samples at different times, one for each month, standardizing an accelerated aging curve.
Variables and Levels for Experimental Tests
The dietary fiber content and amount of sucralose added to the soft drink provide added value to the finished product. It is added with the objective that the dietary fiber raises the nutritional content of the finished product, and the amount of sucralose reduces the calorie levels present in the beverage.
This work used the fiber-density ratio to evaluate the product's sensory and organoleptic quality. The effect of adding dietary fiber in the soft drink is evaluated in sucrose-based beverages partially substituted with 40% sucralose.
The dietary fiber used is soluble in guar gum and does not impact the taste, thus maintaining the naturally enriched profile as an added value. The beverage, partially substituted with 40% sucralose, is intended to reduce the percentage of soluble solids, reduce calories, and add value to the product. Dietary fiber and sucralose are stable at the process temperature.
The dosage for the addition of dietary fiber is given by the manufacturer's recommendation, which indicates an adequate concentration of 1.5% for the product to be declared as a food with a good source of fiber, evaluated in the sucrose-based Beverage and the Beverage partially substituted with sucralose (60% sucrose, 40% sucralose).
The type of study is simply descriptive and pre-experimental, longitudinal since the shelf life of the pasteurized beverage with dietary fiber and partially substituted with sucralose was established, and it was performed during the physical-chemical and sensory analysis (descriptive test).
The process consists of the following steps:
Weighing the ingredients: Mixing ingredients with dietary fiber in soft drinks with different sucrose concentrations through constant agitation. Analyze samples and verify physical-chemical parameters. Pasteurize at 85ºC with a retention time of 2 minutes. Analyze soft drink samples at different shelf life at normal stability for Brix, density, fiber content and microbiological analysis.
Independent variables were studied at two levels: fiber content and sucralose content
They were categorized as follows: Refreshing Drink with Fiber 100 % sucralose, refreshing beverage with Fiber 60 % sucrose + 40% sucralose, refreshing Beverage without Fiber 100% sucrose (Original Formula), refreshing drink without fiber 60% sucrose + 40% sucralose.
As previously mentioned, the samples were worked in a stainless-steel tank with constant agitation, where all the ingredients were added, both in the Beverage with Sucrose and in the one partially substituted with sucralose. Subsequently, the beverage is pasteurized at 85ºC with a retention time of 2 minutes and filled in an aseptic filler at room temperature.
The variables are discrete quantitative.
Indicator: Pasteurization temperature and retention time 11.
Dependent Variables
Density
Soluble fiber is added to beverages as it disperses better in water and sediments less than insoluble fiber. When fiber is added to the soft drink, there is an increase in the texture of the beverage as it becomes dense due to the increase in solids, which is evident when the juice is pasteurized. Particle size must be carefully controlled because excessively large can create a gritty sensation when tasting the product, affecting its sensory characteristics organoleptically. To control the particle size, a homogeneous dry mixture is made with 1 kg. of sucrose and then added to the beverage, stirring constantly to obtain a conforming finished beverage. It is a continuous quantitative variable.
Degrees Brix (Soluble Solids Percentage)
The effect of fiber will be evaluated in two kinds of beverages with different sugar concentrations, where the soluble solids content present in the samples was measured, and at the same time, the caloric content.
Nutritional composition (fiber)
Using gravimetric and enzymatic-chemical methods, the fiber content in the fortified beverage is determined to evaluate its nutritional content.
Parameters that Remained Fixed
The pasteurization temperature at 85°C, the retention time of two minutes, and the amount of acidulants added to the formulation are characteristic parameters of the process that were kept fixed during the experimentation.
Determination of Experimental Runs
The coding applied was orthogonal from the experiment's beginning to obtain the models' independent coefficients. The 100% sucrose soft drink with fiber and without fiber was identified in the trials and substituted with 40% sucralose. In the tests, the value 0 indicates that the beverage is not substituted with sweeteners, and the value 1 indicates the partial substitution of sucrose.
Physical-Chemical Tests for Soft Drinks
An ATC (Automatic Temperature Compensation) digital refractometer was used, which offers a measurement capacity from 0 to 32 degrees Brix. This digital refractometer is widely recognized for its accuracy and ease of measuring sugar concentration in liquids.
The pH meter used was a Hach brand digital meter known for its reliability and accuracy in measuring pH in various applications. This meter offers a measurement capability from 0 to 14, ensuring accurate measurement of the pH of beverages.
A Fisher Scientific glass pycnometer, recognized for its quality in laboratory instruments, was used. This pycnometer has a measurement capacity suitable for beverages, with an accuracy of up to two decimal places in the density measurement.
These instruments are fundamental for characterizing the beverages in the study, as they provide accurate and objective information on their composition and physicochemical properties.
Brix Measurement
The Brix analysis or determination of the percentage of soluble solids in the soft drink employs a manual refractometer with a scale interval of 0 to 32ºBrix.
The rationale is that when the density of the substance increases, the refractive index increases proportionally. This method is based on the relationship between the refractive index and the percentage of soluble solids in a sample, measuring this on a refractometric prism.
The Measurement Scale (%) shows the percentage concentration of soluble solids contained in a sample (aqueous solution). The soluble solids content is the total of all solids dissolved in water, including sucrose, salts, proteins and acids; the measurement read is the total. The Brix percentage (%) is calibrated to the number of grams of sucrose contained in 100 g of sucrose solution. Thus, when measuring a sucrose solution, Brix (%) should be equivalent to the actual concentration.
Determination of Titratable Acidity as a percentage of Citric Acid
The determination is based on alkaline metric titration or titration. This analytical method detects the percentage of acidity by neutralizing the H+ ions with a basic solution such as sodium hydroxide at 0.1 N concentration.
For the soft drink evaluated, the acidity parameter is 0.30 to 0.32.
The following equation is used to express the result:
% Acidity = V * N * Meq x 100 / M
Where:
· V = Volume of NaOH 0.1 N consumed in the titration.
· N = Normality of the NaOH used in the titration.
· Meq = Equivalent weight of the predominant acid.
· M = Grams of sample weighed or measured.
Milliequivalents:
· Citric Acid: 0.064 (with this value, the analysis was performed).
Density Determination
To determine this parameter, a pycnometer was used, which relates the mass of a given volume of liquid, in this case, the lemon-flavored soft drink at 20ºC and the mass of the same volume of pure water at the same temperature. The procedure followed is described below.
Empty Pycnometer Mass
The pycnometer was cleaned with chromo sulfuric acid, rinsed several times with distilled water, and left to dry at room temperature. After putting the stopper on, it is left to stand for 15 minutes in the box of the balance and then weighed to four decimal places. The average of three determinations must be made.
Mass of the water-filled pycnometer
The same pycnometer is filled a little above the level with distilled water, covered and left for 30 min. in a water bath at 20ºC. With the help of a capillary, the lower edge of the meniscus or curved surface of the liquid is made to coincide precisely with the flush. Then, the empty part of the pycnometer is dried with filter paper, the stopper is placed, and after removing it from the water bath, it is dried well without leaving residues; it is placed on the balance for 30 min and weighed with an accuracy of four decimal places. Three determinations are made.
Mass of the Pycnometer Filled with the Test Sample
The water-filled pycnometer is emptied and carefully washed several times with small fractions of the test sample (5 to 10 mL). After filling it with the test substance slightly above the level, the procedure for the water-filled pycnometer is followed.
For the calculation of the relative density at 20ºC it is calculated as follows:
Where:
m1= mass in g. of the empty pycnometer.
m2= mass in g. of the water-filled pycnometer at 20ºC.
m3= mass in g. of the pycnometer filled with the test sample at 20 ºC.
The factor m2 - m1 is the same for all determinations if the same pycnometer is used and only needs to be checked occasionally.
Determination of pH
The purpose of pH measurement is to determine a substance's degree of acidity or basicity, i.e., the concentration of H+ or OH- ions, respectively. Its basis is measuring the degree of acidity or basicity with a potentiometer, using an electrode sensitive to the molar concentration of hydrogen ions in the sample solution. The pH range of the lemon-flavored soft drink is in the range of 3 to 3.4.
Determination of Dietary Fiber
We used a mixed method such as gravimetric and enzymatic-chemical; the type of measured fiber used was the total fiber; it was considered that the optimum temperature is 32ºC for four months because it is the average ambient temperature of the city of Guayaquil, as it was taken as reference the study entitled "Effect of the Use of Dietary Fiber in the Composition of two Drinks with Different Types of Sweeteners," conducted by Salazar (2012), where he studied this type of fiber and determined its helpful life by accelerated aging.
Methods for determining dietary fiber can be broken down into gravimetric methods and enzymatic-chemical methods.
Gravimetric methods are based on weighing the residue remaining after enzymatic or chemical solubilization of the non-fiber components.
Enzymatic-chemical methods consist of isolating the dietary fiber residues by enzymatic action and releasing by acid hydrolysis the neutral sugars that constitute the polysaccharides of the fiber and measuring them by high-pressure liquid chromatography (HPLC), gas chromatography (GLC) or colorimetrically. Uronic acids are determined colorimetrically or by decarboxylation, and lignin is generally determined gravimetrically 12.
Gravimetric methods are more straightforward and faster; they are limited to calculating total fibers or soluble and insoluble fibers. Enzymatic-chemical methods, conversely, are more complex and slower; they provide the amount of each of the neutral and acid sugars; lignin can be estimated separately and added to the sum of the individual sugars, giving the total fiber content.
The main methods and the fraction to be analyzed in each method are listed below.
Gravimetric MethodsChemical Gravimetric
Crude Fiber
It is based on sequential treatment with acids and alkalis under standardized conditions. With this method, the dietary fiber content is significantly underestimated since most of the hemicellulose, lignin, variable amounts of cellulose, and all the soluble fiber are dissolved.
Crude fiber values do not accurately reflect human foods' accurate dietary fiber content. The dietary fiber content is typically 3 to 5 times higher than the crude fiber values. However, it is impossible to apply a correction factor universally because the ratio of crude fiber to dietary fiber varies based on the chemical composition of the food. Crude fiber is of limited physiological significance in human nutrition and should not be relied upon to determine the fiber content of foods.
Acid Detergent Fiber
This method involves boiling the sample with cetyltrimethylammonium bromide in an acid medium and subsequent filtration and washing of the residue. This method gives a reasonable estimate of cellulose and lignin. The residue can be analyzed for cellulose or lignin 13.
Neutral Detergent Fiber
This method includes extracting the food sample with a hot solution of sodium lauryl sulfate, followed by determining the residue gravimetrically 14.
This method gives a reasonable estimate of insoluble fiber (cellulose, hemicellulose and lignin) and has been widely used to evaluate food for human consumption.
The advantage of this method is that it allows the determination of insoluble fiber using a relatively simple method. The major disadvantage is that soluble fiber is lost. The difference between the neutral and acid detergent methods gives hemicellulose, but there are potential errors associated with this estimation, so the direct measurement of hemicelluloses is emphasized 15.
Simplified total dietary fiber
Recently, a non-enzymatic gravimetric method was developed to analyze total dietary fiber (TDF) in products with low starch content, such as fruits and vegetables (16). This method has been collaboratively studied under the auspices of the AOAC. For most starch-containing diets, this method overestimates the TDF content.
Enzymatic gravimetric
These methods are based on digesting proteins and carbohydrates with enzymes; the remainder is allocated to dietary fiber after discounting the remaining ash and protein content. Insoluble fiber can be determined alone or by alcohol precipitation, and soluble fiber can be included and determined separately or together.
Several techniques have been reported, such as the technique of Asp and co-workers 17, which employs Termamyl as alpha-amylase, pepsin and pancreatin and allows the determination of total dietary fiber or separated into soluble and insoluble; that of Pak and co-workers 18; which using the same enzymes, introduces modifications that simplify the determination; and that of Prosky and collaborators 19, based on that of Asp and other researchers, which determines total dietary fiber using Termamyl, protease and glucoamylase and that due to the fact of working with bacterial enzymes, it is necessary to verify that there is no presence of enzymatic activity that digests the fiber (pectinases, hemicellulases). The method is more straightforward, faster and schematic than Asp's, and both techniques have a reasonable correlation.
The main advantages of these methods are that they are relatively accurate and precise compared to other procedures. Furthermore, these techniques are straightforward, cost-effective, and simple to execute without needing extensively trained staff or significant capital investment. This contrasts with more complex methods involving gas chromatography or high-pressure liquid chromatography.
These methods are considered the most suitable for routine analysis for fiber labeling and quality control purposes 20.
Chemical-Enzymatic-Gravimetric
Total Dietary Fiber (Neutral Detergent Fiber + Soluble Fiber)
Years ago, a non-enzymatic gravimetric method was developed to analyze total dietary fiber (TDF) in products with low starch content, such as fruits and vegetables 21. This method has been collaboratively studied under the auspices of the AOAC. For most starch-containing diets, this method overestimates the TDF content.
The value thus determined agrees with the values of total dietary fiber measured by enzymatic gravimetric methods that have already been reported. The AOAC approved this method for total dietary fiber determinations only, not soluble and insoluble ones.
Enzymatic-Chemical Methods
The fiber residue obtained after enzymatic digestion is hydrolyzed with solid acids to liberate monomeric sugars, which are determined colorimetrically by GLC or HPLC. Acid sugars are quantified by decarboxylation and measurement of the carbon dioxide released or colorimetrically. Lignin is determined gravimetrically in some techniques.
Colorimetric
In acid solutions, carbohydrates produce condensation reactions with many substances, giving colored products that can be measured spectrophotometrically.
Southgate method
It is based on the fractionation of dietary fiber into soluble and insoluble non-cellulosic polysaccharides measured colorimetrically as hexoses, pentoses and uranic acids, cellulose as glucose, and lignin gravimetrically as insoluble residue in sulfuric acid (H2SO4) 72%. The advantage is that it gives rich information on the fiber components. Its disadvantage is that it is complex, it overestimates the dietary fiber value because it does not consider the hydration of sugars when hydrolyzing polysaccharides 22 and because the colorimetric reactions it employs of hexoses, pentoses and uranic acids with anthrone, orcinol and carbazole respectively are not very specific).
Liquid Gas Chromatography
Analyzes the sugars that compose the dietary fiber after derivatization to volatile compounds and separation with gas-liquid chromatography, generally 5-6 neutral monomers.
Method of Englyst and Cols
This technique makes it possible to determine non-starch polysaccharides, non-cellulosic polysaccharides and insoluble non-starch polysaccharides in the same assay. Lignin cannot be measured. It should be noted that resistant starch is not included in the determination of dietary fiber as opposed to the determination of dietary fiber by enzymatic-gravimetric methods.
Since its inception, the method has undergone several modifications to improve its accuracy 23. An important point is that polysaccharides other than soluble starch are calculated as the difference between total and insoluble fiber. Wolters et al. (24) report that overestimating the amount of polysaccharides that are not soluble starch could be why this component was calculated as the difference between total and polysaccharides that are not insoluble.
Method of Theander and Cols
Three methods are described that allow the determination of total dietary fiber or broken down into soluble and insoluble (25). GLC, uronic acids by decarboxylation and lignin by gravimetry analyze neutral sugars. This method includes resistant starch and lignin.
A recent version of the method for rapid analysis of dietary fiber (Uppsala method) has been released (26).
High Pressure Liquid Chromatography
The monosaccharide composition of dietary fiber residues is determined using HPLC 27. Although this method appears promising, its accuracy must be evaluated in collaborative studies.
Chemical analysis
Soluble solids, acidity, pH, density and nutritional content (fiber).
RESULTS
The results of the tests performed on the soft drink to determine the response variables were statistically analyzed using STATGRAPHICS software.
ANOVA was used to evaluate whether significant differences in beverage composition were due to dietary fiber and the different sweeteners. Tukey's test, which is a post hoc test, was used to identify which specific groups differed from each other in case significant differences were found in ANOVA.
The triplicate results of each trial were initially evaluated for significant differences attributable to the treatments. The validity of the data was checked by performing analyses of their distributions and considering a relative error of less than 10%. The multiple comparison test was used to verify the deviation of the means and the overlap of their tails. Finally, as an expected result, a multiple regression was performed, assessing the validity of each of the coefficients within the probabilistic model.
Current computer programs calculate the p-value automatically, and for the interpretation of the various results, this calculated value is compared against a preset confidence level, which generally is 95%.
Measuring °Brix is essential in producing and quality control carbonated soft drinks, as it is directly linked to their sugar content. This scale measures the percentage of soluble solids, mainly sugars, present in an aqueous solution. In carbonated soft drinks, the main soluble solid is sucrose. The higher the °Brix value, the higher the concentration of dissolved sugars in the beverage. By monitoring and adjusting °Brix levels, manufacturers can achieve the desired sweetness, flavor, quality and consistency in their products while meeting regulatory requirements and ensuring product safety and shelf life.
Samples SF0 and CF0 had a composition of 100% sucrose as sweetener, reflected in their °Brix values close to 11, indicating a high sucrose content. On the other hand, samples SF1 and CF1 contained a mixture of 60% sucrose and 40% sucralose, resulting in °Brix values around 7, indicating a lower sucrose content than the pure sucrose samples. This is evidence that samples with higher sucrose content (SF0 and CF0) had higher °Brix values, while samples with lower sucrose content (SF1 and CF1) had lower °Brix values. In summary, there is a direct correlation between sucrose content in the soft drink formulation and the °Brix values recorded, where higher sucrose content translates into higher °Brix value.

Table 1. Independent variables were manipulated during the experiment.
A factorial design 22
Table 2 shows the compilation of the variables used in the experiment.

Table 2. Design of the experiment. Design 22 = 4 runs in triplicate (for each month and two months).
Table 3 shows the corresponding coding, in which a code is also assigned to each test to identify the samples quickly. All tests are performed in triplicate.

Table 3. Experimental Runs
Results and Statistical Analysis of Physical and Chemical Tests of Soft Drinks
Nutritional Composition (Fiber)
The determination of the percentage of dietary fiber in the soft drink samples yielded the results presented in Table 4, with the effect of fiber before pasteurization and follow-up every 15 days up to 4 months compared. The coding used for the samples is detailed in the Materials and Methods section.
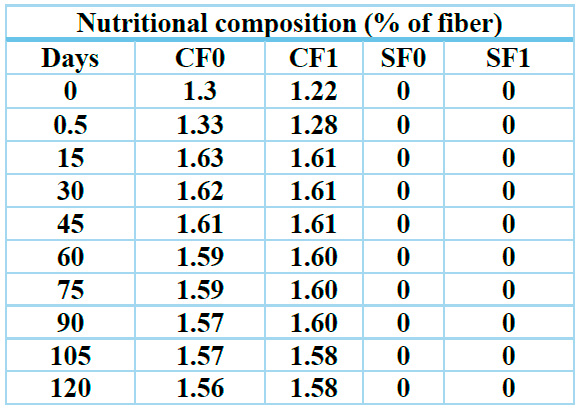
Note: CF0 = Samples containing only Sucrose, CF1= Samples in which sucralose, SF0=, SF1=, has partially substituted sucrose. Day 0 is considered the unpasteurized beverage.
Table 4. Results of fiber behavior over time.

Figure 1. The amount of fiber in the soft drink was evaluated for 4 months.
The ANOVA table decomposes the variance of the data into two components: a between-group component and a within-group component. The F coefficient, equal to 0.017685, is the ratio of the between-group estimate to the within-group estimate. Since the p-value of the F-test is greater than or equal to 0.05, there is no statistically significant difference between the means of the 2 variables containing fiber, for 95.0% confidence. Table 5 presents the following results obtained.

Table 5. Analysis of variance for fiber quantity.
According to this graph of averages, it is established that the amount of fiber is maintained over time, i.e., there is no indication of degradation, both for samples containing only Sucrose (CF0) and for those in which sucrose has been partially substituted by sucralose (CF1).
Figure 2 shows the graph of the means and their intervals for 95% confidence.

Figure 2. Graph of averages.
Soft Drink Density
Table 6 shows the density of carbonated beverages over time for four different types of beverages: CF0, CF1, SF0 and SF1. It is observed that the density of all beverages varies slightly during the first few days but then tends to stabilize. CF0 and SF0 beverages tend to have a higher density compared to CF1 and SF1, which could indicate differences in ingredient composition or concentration. In addition, it is observed that the density of all beverages tends to increase over time, which could be due to evaporation of water or other physical or chemical changes in the beverage.

Table 6. Results of the behavior of beverage density over time.

Figure 3. Density behavior of the soft drink was evaluated for 4 months.
The ANOVA table decomposes the variance of the data into two components: a between-group component and a within-group component. The F-ratio, which in this case is equal to 34.5702, is the ratio of the between-group estimate to the within-group estimate, known as the F-test. Since the p-value of the F-test is below 0.05, there is a statistically significant difference between the means of the four variables at the 95.0% confidence level. The multiple range test was utilized to identify which means are significantly different.

Table 7. Displays the outcomes of the multiple-range test.
Table 8 applies a multiple comparison procedure to determine the means that are significantly different from each other. The lower half shows the estimated difference between each pair of means. The asterisk next to five pairs indicates that they show statistically significant differences at the 95.0% confidence level. At the top of the page, three homogeneous groups are identified according to the alignment of the X sign in the column. Within each column, the levels with an X sign form a group of means between which no statistically significant differences exist. The current method employed for distinguishing between means is Fisher's Least Significant Difference (LSD) procedure. This approach entails a 5.0% probability of incorrectly identifying each pair of means as significantly different when their actual difference is 0.

Table 8. Homogeneous groups (density).
As presented in Figure 3, the density varies significantly depending on the amount of sugar or fiber added to the beverage due to the percentage of solids incorporated in the beverage. Table 8 and Figure 4 show that in terms of product density, there are no statistically significant differences between the beverage with fiber and partially substituted sucralose for sucrose and the beverage without fiber and with 100% sucrose, i.e., the original beverage. Therefore, using fiber and sucralose would yield a product with a density similar to the original product. Using fiber and 100% sucrose would make it a denser beverage, while the beverage without fiber and sucralose would offer a less dense product than the current one.

Figure 4. Comparison of different density averages.
Variation of ºBrix of the beverage
Table 9 shows the evolution of the Brix degree of the beverages over time for four different types. It is observed that CF0 and SF0 beverages, which contain sucrose as the primary sweetener, have higher initial Brix values compared to CF1 and SF1, which contain a mixture of sucrose and sucralose. Over time, variations in Brix values are observed, possibly due to the sugars' fermentation or other degradation processes. Beverages with pure sucrose tend to maintain higher Brix values than beverages containing sucralose.

Table 9. Results of beverage ºbrix behavior over time.

Figure 5. ºBrix performance of the soft drink was evaluated for 4 months.

Table 10. Analysis of variance for ºbrix.
The ANOVA table (Table 10) shows that the F-ratio in this case equals 1456.03. As the F-test's p-value is below 0.05, a statistically significant difference exists between the means of the four variables at a 95.0% confidence level. To ascertain which means are significantly different from one another, a Multiple Range test was conducted.

Table 11. Homogeneous groups (ºbrix).
Table 11 shows that four pairs present statistically significant differences at a confidence level of 95.0%. At the top of the page, two homogeneous groups are identified according to the alignment of the X sign in the column. The method used to discern between the means is the LSD procedure.

Figure 6. Graph of means (ºbrix).
From Figures 5 and 6 and ratified with the analyses in Table 11, it can be seen that the ºBrix are different depending on whether the beverage was made with 100% sucrose or if sucralose was partially substituted by sucralose. Hence, it is shown that the presence of sugar determines the Brix, depending on whether it is sucrose or sucralose.
The slight increase in ºBrix with time may be due to the evaporation of water during storage due to the difference in partial pressures, resulting in a higher concentration of soluble solids in the beverage.
To determine the model to establish the effect of dietary fiber in the soft drink as a function of the variables studied, the values of ºBrix and fiber content as a function of time were taken for the analysis.

Table 12. ºBrix behavior as a function of time.
Figure 7. Shows the results of fitting a simple linear regression model to describe the relationship between ºBrix in CF1 and time. The fitted model equation is: ºBrix in CF1 = 7.2788 + 0.0028*Days.

Figure 7. Graph of the model fitted to relate ºbrix vs. time for the soft drink CF1.
Coefficients

Correlation Coefficient = 0.76878
R-squared = 59.1023 percent
R-squared (adjusted for l.g.) = 53.9901 percent
Standard error of the est. = 0,106292
Mean absolute error = 0.0817464
Durbin-Watson statistic = 2.44471 (P = 0.6330).
Table 13. Analysis of the regression model to relate ºbrix and time
The p-value in the Analysis of Variance table below 0.01 indicates a statistically significant relationship between the variables at a 99% confidence level.
The R2 statistic suggests that the model accounts for 59.1% of the variation in ºBrix of the CF1 sample. The estimation's standard error indicates that the residuals' standard deviation is 0.1063.

Table 14. Behavior of % fiber as a function of time.
Figure 8. Shows the fit of a model obtained by nonlinear regression relating the variable % fiber and time. The program used was Statgraphics. The equation of the fitted model is: % fiber= 0.3804*(4.2030-exp (-0.3645*time (days))).

Figure 8. Graph of the model fitted to relate % fiber vs. time for the soft drink CF1.

R-squared = 99.4269 percent
R-squared (adjusted for l.g.) = 99.2631 percent
Standard error of the est. = 0.0127
Mean absolute error = 0.0079
Table 15. Shows the analysis of the obtained nonlinear regression model.
The R-squared statistic indicates that the adjusted model explains 99.4269% of the variability in % fiber. The adjusted R-squared statistic, preferable for comparing models with varying numbers of independent variables, is 99.2631%. The estimate's standard error indicates that the residuals' standard deviation is 0.0127. The mean absolute error (MAE) of 0.0079 represents the average value of the residuals.
Variations in density can have significant implications on sensory perception and product stability, affecting taste, texture and perceived quality. Therefore, it is critical to understand the implications of density variations on soft drink quality to ensure consistent, high-quality products.
Brix (°Brix) measures the sugar concentration in a solution, expressed in degrees on the Brix scale. In the case of soft drinks, the ºBrix is crucial because it indicates the sugar content in the beverage, which influences its taste, sweetness and quality. A higher ºBrix indicates a higher sugar concentration and a sweeter taste.
Variations in ºBrix over time can have several implications. On the one hand, they can affect the taste and quality of the soft drink. If ºBrix decreases, the soft drink may become less sweet and palatable. On the other hand, variations in ºBrix may also indicate changes in the composition or stability of the soft drink. If the ºBrix increases over time, it could indicate a higher sugar concentration due to water evaporation, which could affect the quality and consistency of the product.
DISCUSSION
According to Villanueva (2019)28. The consumption of dietary fiber brings health benefits, and its consumption in many countries of the world is lower than recommended. A more excellent supply and consumption of refined products can explain the low fiber consumption. In whole wheat products, wheat undergoes no traditional refining processes, which helps maintain the balance of soluble and insoluble dietary fiber compared to refined products. As a result, the nutritional contribution and quality of whole wheat products are higher.
Several investigations have confirmed that dietary fiber, due to its physicochemical properties, is closely related to treating certain gastrointestinal diseases, such as irritable bowel syndrome, diverticulitis and constipation. It also influences the functionality of the gastrointestinal tract, including intestinal transit, intestinal microbiota and micronutrient availability. Epidemiological and clinical research has demonstrated that fiber-rich foods, such as whole grains, legumes, fruits, and vegetables, regulate digestion and absorption processes. It is anticipated that a deeper understanding of the physicochemical characteristics of dietary fiber will significantly enhance the management of traditional symptoms associated with gastrointestinal disorders.
It is estimated that sucralose is, on average, about 600 times sweeter than sucrose on a weight-for-weight basis. Therefore, a minimal amount of sucralose (1/600) can replace sugar, so the same level of sweetness can be achieved on a weight basis. The sweetness of sucralose depends on the concentration in the final product and the characteristics of the food or beverage according to the system using all major non-caloric sweetener products formulated for consumption (such as tabletop sweetener sachets), including those using sucralose, contain some type of bulk carrier, such as maltodextrin, to provide bulk so that the low-calorie sweetener can be used, more volumetrically than sugar. These carriers or fillers may have some nutritional value, but calories per serving must remain low. For example, in the US, "no-calorie" sweeteners must have 5 or fewer calories per serving, which is also considered a trivial amount.
According to a study by Agulló et al. (2022), 29 sucralose offers several significant beverage advantages. Its ability to provide sugar-like sweetness without adding calories makes it attractive to those looking to reduce their sugar and calorie intake. In addition, its high heat and pH stability ensures that it maintains its sweetness and quality even under harsh processing conditions. Its clean taste and no bitter aftertaste make it a popular choice for enhancing the flavor of beverages without compromising their quality.
Nonetheless, more recent research indicates that sucralose may lead to dysbiosis, an imbalance in intestinal flora. This imbalance can disrupt hormone metabolism and potentially elevate the risk of conditions such as obesity, diabetes, or lactose intolerance.
The food industry in Ecuador has an excellent opportunity to develop and introduce mass-consumption products with high fiber content into the market. This can be reinforced by campaigns of health regulatory entities, highlighting the benefits of fiber consumption in the population's health, which could also lead to savings in treating cardiovascular diseases and type 2 diabetes. In traditional Ecuadorian gastronomy, juices or natural juices are present in daily meals, especially at lunch. In this case, fruit juices are rich sources of dietary fiber, especially in their peel; however, when the peel of certain foods is removed, the fiber is lost.
According to a study conducted by Naranjo and Pastor (2009)30, Ecuadorians maintain a clear preference for traditional beverages, such that 79% of those surveyed consume natural juices daily and approximately 92.5% consume milk in Quito, while in Guayaquil, 76% of those surveyed consume milk and natural juices daily.
According to a study by Li (2019), 31 mentions that sucralose is an artificial sweetener that provides sugar-like sweetness without adding significant calories, making it attractive to people who want to reduce their sugar and calorie intake. Its high heat and pH stability make it ideal for beverages requiring heat processing or low pH, such as carbonated soft drinks and acidic juices.
On the other hand, Magnuson et al. (2017)32 presented a series of investigations in which they agree that the consumption of sucralose is safe and that the addiction of the same beverages generates a significant impact since it reduces costs and its characteristics remain intact.
According to studies by Lin et al. (2018)33, adequate dietary fiber intake has been associated with numerous health benefits, including regulation of intestinal transit, prevention of constipation, reduced risk of cardiovascular disease and improved glycemic control in people with diabetes. Higher dietary fiber intake has been associated with a reduced risk of developing chronic diseases, such as type 2 diabetes and certain types of cancer.
In their study, Zhang et al. (2022)34 mentioned that consumers' beverage preferences are varied and influenced by various factors. Many people prefer traditional beverages that have long been part of their culture or diet, as they are familiar and comforting. On the other hand, consumers looking for healthier options often opt for natural juices, perceived as fresh, nutritious and free of artificial additives. Milk is also popular because of its taste, versatility and health benefits, especially as a source of calcium and other essential nutrients. In addition, there is a growing preference for functional beverages that offer additional health benefits, such as those containing dietary fiber. In this sense, the development of products with dietary fiber should consider these preferences and offer beverages that are not only healthy and functional but also attractive and satisfying to consumers.
Consistent with the study by Salazar et al. (2023)35, mentioning that the incorporation of dietary fiber in soft drinks could be tailored to consumer preferences by offering an option that combines health benefits with familiar and pleasant flavors, soft drinks with natural fruit flavors containing dietary fiber could be developed, providing a more nutritious alternative to consumers who prefer natural juices. In addition, dietary fiber could be added in a way that does not negatively affect the texture or taste of the soft drink, thus maintaining its appeal to those seeking refreshing and tasty beverages. In this way, incorporating dietary fiber into soft drinks could satisfy consumer preferences by offering a healthy and functional option without compromising the taste and quality of the product.
Variations in Brix over time can significantly affect product quality and stability. While Brix measures total soluble solids, mainly sucrose, indicating sweetness and quality, it can change due to various factors over time. For example, changes in properties like pH, acidity, ascorbic acid content, viscosity, color, and pulp settling are observed in fruit storage. A study reported total soluble solids expressed as °Brix for blackberries with and without coating after ultrafreezing storage at -80°C. The coated blackberry sample had an average Brix of 10.4°, while the uncoated sample had an average Brix of 9.88°. This suggests that the coated blackberries had a slightly higher sugar content, affecting their sweetness and overall quality. Brix measurement is crucial for evaluating the ripeness, sweetness, and quality of fruits like blackberries, providing critical insights into their sugar content.
This study focuses on optimizing the production process for a ready-to-serve, low-calorie, high-fiber beverage made from buttermilk and watermelon. The study considers three independent variables: whey concentration, Innova fiber, and sucralose. Various sensory and physical properties of the beverage were assessed to determine the optimal concentrations of these variables, which were found to be 51.46% for whey, 3.84% for Innova fiber, and 0.021% for sucralose. The study noted that increasing the concentration of sucralose had a significantly negative effect on the taste score of the beverage. Additionally, the interaction between whey concentration and Innova fiber impacted the flavor score, indicating a negative effect.
The study revealed a significant relationship between Brix levels and the release of flavor compounds and sensory perception in the analyzed samples. A positive correlation was noted between a Brix level of 5.2 and the "citrus/non-orange" retronasal quality, indicating that this specific quality could be due to lower concentrations of volatile compounds in the beverage with 5.2 Brix. Moreover, the sample exhibiting a Brix level 14.2 significantly correlated with all volatile and sensory data employed in the principal component analysis. This indicates that perceived variations in retronasal evaluation could be linked to increased bitterness, sweetness, and observable physical characteristics.
Although the study focused on the influence of dietary fiber in beverages, it could have benefited from including other relevant variables, such as the sensory impact of changes in beverage composition.
The duration of the study, which covered 4 months at a constant temperature of 32°C, might not have been sufficient to fully capture the long-term effects of fiber addition and partial substitution of sucralose in the beverages.
Because the study focused on a specific experimental design with controlled conditions, generalization of the results to real-world situations might be limited. Additional studies in more diverse settings would be needed to validate the findings fully.
Although the impact of sucralose addition in beverages was evaluated, there is no mention of whether it was compared to other low-calorie sweeteners. Including such a comparison would have provided a broader perspective on the effects of different sweeteners on beverage composition.
These limitations highlight areas where the study could have been more comprehensive or detailed, suggesting the need to consider these aspects in future research to obtain a complete and more accurate picture of the effects of dietary fiber in beverages.
CONCLUSIONS
The study found no statistically significant difference in fiber content between samples containing only sucrose and those partially substituting sucrose with sucralose. This indicates that the fiber content remained consistent over time without degradation. Analysis of the soft drinks' physicochemical parameters, such as acidity, pH, density, and fiber content, showed significant differences between beverages with low and high sucrose content. The inclusion of dietary fiber affected the beverages' composition, underscoring the need to monitor and adjust these parameters for quality control. The study concluded that adding these products over time increased the beverage's percentage of solids. This increase is likely due to water evaporation during the stability test, leading to a higher concentration of soluble solids in the beverage.
A model was obtained to relate the percentage of fiber with the time elapsed since its preparation. The model is valid within the value interval of the variable studied, dietary fiber, for a content of 1.2 to 1.6% by weight. In this interval, according to the nutritional content requirements related to fiber by the FDA, the formulated product should be declared as a food with a good source of fiber since it contains 10 to 19% of the ADI (2.5 to 4.9) per serving. It should be noted that the tests were carried out using high-quality raw materials.
The statistical analysis using the LSD procedure identified significant differences in four pairs of samples at a confidence level of 95.0%. This method helped distinguish between homogeneous groups based on the physicochemical characteristics of the soft drinks. The analysis of variance conducted on ºBrix values revealed a statistically significant difference among the means of the four variables assessed. This highlights the necessity of monitoring ºBrix levels in beverages to uphold product quality and adhere to regulatory requirements.
In summary, this research offers valuable insights into how dietary fiber influences the composition of soft drinks containing various sweeteners. It underscores the significance of monitoring physicochemical parameters to ensure quality control and product consistency.
Author Contributions:
Funding: This research received no external funding.
Acknowledgments: Our thanks to the University Technical de Babahoyo.
Conflicts of Interest: No conflict of interest
REFERENCES
1. Insight S.A “’La Globalización en el Ecuador y su influencia en la búsqueda de nuevas estrategias de mercado en la Industria de las Bebidas’’. Estudio realizado al mercado de Bebidas en el Ecuador. 1 (2) 14- 20, 2009.
2. Novarom, J., Emulsiones para la industria de bebidas, Editorial San Martín, Buenos Aires Argentina 1era Edición, 25- 33, 2001.
3. Ranken M.D., Manual de industrias de los alimentos, Editorial Acribia, S.A, España 2da Edición, 65, 1993.
4. Fennema, O. R., Química de los alimentos, Editorial Acribia, S.A, España 3era Edición, 123- 127, 1996.
5. Hawthorn, K., Aditivos alimentarios en la industria de alimentos, Editorial Everest, México 3era Edición, 56- 59, 2000.
6. Adrian, J. Y Frangne, R., La Ciencia de los Alimentos de la A a la Z, Editorial Acribia, S.A, España 1era Edición, 15-18, 1990.
7. Dreher, M., “Fibra dietaria contenida en frutos y hortalizas”, Revista de Alimentos. 2(3) 6-9, 2003.
8. Miranda Alvaro M., Fibra Dietaria en la nutrición, Editorial Marcus, S.A, México 2da Edición, 11-15, 2009.
9. Lindley, M.G. “Nuevos desarrollos en edulcorantes bajo en calorías’’. Exámen Mundial de Nutrición y Dietética 85: 44-51 (1999).
10. Borrego, F., Tipos de edulcorantes calóricos o nutritivos, Editorial Zeus, Chile 2da Edición, 110-114, 2000.
11. Wells, A.G., El uso de edulcorantes no calóricos en bebidas, Editorial Durlan, EEUU, 4ta Edición, 36- 41, 1998.
12. López J. Martínez A.B., Determinación de fibra dietaria por gravimetría, Editorial Torreón, México 1era Edición, 10-13, 1999.
13. Goering, H.K. and Van Soest, P.J. 1999. Forage fiber analysis. Washington DC, US Department of Agriculture. (Agriculture Handbook 379).
14. Robbins, C.T., Determinación de fibra por el método no enzimático, Editorial Clint, EEUU, 5ta Edición, 67-71, 2005.
15. Li, B.W. and Cardozzo, M.S. 2002. Nonenzymatic-gravimetric determination of total dietary fiber in fruits and vegetables. (J. AOAC Int. 75:372-374)
16. Asp., NG, et al. 1997. Siljestrom; A rapid enzymatic assay of insoluble and soluble dietary fiber. (J. Agric. Food Chem. 31: 476-482).
17. Asp., NG, et al. 1999. A rapid and simultaneolas determination of soluble and insoluble dietary fiber. (Nutr. Rep. Int. 40:551-565).
18. Pak, N., et al. 1992. Determination of insoluble and soluble dietary fiber in foods and food produces; Collaborative Study. (J. AOAC Int. 75:360-367).
19. Lee, S.c.; Prosky, L. and Tanner, J.T. 1993. Quality Assurance for analytical laboratories, Mparkany (De). London, Royal Society of Chemistry.
20. Mongeau, R. and Brassard, R. 2004. Determination of total, soluble and insoluble dietary fiber; Collaborative study of a rapid gravimetric method (Cereal Foods World 35: 319-324).
21. Selvendran, D.AT. 2000. Determination of carbohydrates in foods. Unavailable carbohydrates. (J.Sci. Food Agric. 20:331-335).
22. Southgate, R. and Du Pont, MS 2001. Simplified methods for the preparation and analysis of dietary fiber. (J. Sci. Food Agric. 31:1173-1182).
23. Englyst, H.N., Cumming, J. and Wood, R. 1997. Determination of dietary fiber in cereals: study of further simplified procedures. (J. Assoc. Publ. Anal. 25:59-71).
24. Wolters, M.G., et al. 2002. Comparison of different methods for determination of dietary fiber. (J. AOAC Int. 75:626-634).
25. Theander, O. and Westerlund, E.A. 2006. Studies on dietary fiber. 3. Improved procedures for analysis of dietary fiber. (J.Agric.Food Chem. 34:330-336).
26. Theander, O., et al. 2000. The Uppsala method for rapid analysis of total dietary fiber. In: Furda, I. and Brine, C.J., eds. new developments in dietary fiber. New York, Plenum Press, pp. 273-281.
27. Hicks, KB. 2003. High-performance liquid choroma- tography of carbohydrates. (Adv. Carbohydr. Chem. Biochem. 46: 17-72).
28. Villanueva, R. 2019. Fibra dietaria: una alternativa para la alimentación. Ingeniería Industrial, núm. 37, pp. 229-242. https://doi.org/10.26439/ing.ind2019.n037.4550
29. Agulló, V., García-Viguera, C., & Domínguez-Perles, R. (2022). The use of alternative sweeteners (sucralose and stevia) in healthy soft-drink beverages, enhances the bioavailability of polyphenols relative to the classical caloric sucrose. Food Chemistry, 370, undefined-undefined. https://doi.org/10.1016/j.foodchem.2021.131051
30. Naranjo, C y Pastor, B. “’La Globalización en el Ecuador y su influencia en la búsqueda de nuevas estrategias de mercado en la Industria de las Bebidas’’. Estudio realizado al mercado de Bebidas en el Ecuador. 1 (6) 14- 20, 2009.
31. Li, S. (2019). Optimization of Determination of Sucralose in Drink by HPLC. Journal of Economic Science Research, 2(3), Article 3. https://doi.org/10.30564/jesr.v2i3.1023
32. Bernadene A. Magnuson, Ashley Roberts, Earle R. Nestmann, Critical review of the current literature on the safety of sucralose, Food and Chemical Toxicology, Volume 106, Part A, 2017, Pages 324-355, ISSN 0278-6915, https://doi.org/10.1016/j.fct.2017.05.047.
33. Lin, D., Peters, B. A., Friedlander, C., Freiman, H. J., Goedert, J. J., Sinha, R., Miller, G., Bernstein, M. A., Hayes, R. B., & Ahn, J. (2018). Association of dietary fibre intake and gut microbiota in adults. British Journal of Nutrition, 120(9), Article 9.
34. Zhang, S., Tian, J., Lei, M., Zhong, C., & Zhang, Y. (2022). Association between dietary fiber intake and atherosclerotic cardiovascular disease risk in adults: A cross-sectional study of 14,947 population based on the National Health and Nutrition Examination Surveys. BMC Public Health, 22(1), Article 1. https://doi.org/10.1186/s12889-022-13419-y
35. Salazar-Bermeo, J., Moreno-Chamba, B., Heredia-Hortigüela, R., Lizama, V., Martínez-Madrid, M. C., Saura, D., Valero, M., Neacsu, M., & Martí, N. (2023). Green Technologies for Persimmon By-Products Revalorisation as Sustainable Sources of Dietary Fibre and Antioxidants for Functional Beverages Development. Antioxidants, 12(5), Article 5. https://doi.org/10.3390/antiox12051085
Received: April 5, 2024 / Accepted: May 22, 2024 / Published: June 15, 2024.
Citation: Salazar Llorente E J, Cobos Mora F J, Viteri García I P, Bucaram Lara G R Impact of Dietary Fiber on Soft Drinks with Varied Sweeteners. Bionatura Journal 2024; 1 (2) 10. http://dx.doi.org/10.10.70099/BJ/2024.01.02.10
Additional information
ISSN 3020-7886
Correspondence should be addressed to ejsalazar@utb.edu.ec
Peer review information. Bionatura Journal thanks the anonymous reviewers for their contribution to the peer review of this paper using https://reviewerlocator.webofscience.com/.
All articles published by Bionatura Journal are freely and permanently accessible online immediately upon publication, with no subscription fees or registration barriers.
Editor's note: Bionatura Journal remains neutral regarding jurisdictional claims in published maps and institutional affiliations.
Copyright: © 2024 by the authors. Submitted for possible open-access publication under the terms and conditions of the Creative Commons Attribution (CC BY) license (https://creativecommons.org/licenses/by/4.0/).