


Development and Validation of a Phenomenological Model for Scalable Size-Exclusion Chromatography in TNF-Blocking Peptide Purification

Pedro Pablo Aguilar Domínguez +1,3, Fátima Reyes López +1 , María A. Contreras Vera 2,
Constanza Quiroga Moreno 1, Jorge R. Toledo Alonso 2,4, Claudio A. Zaror 3,
Frank Camacho Casanova 1,5, Oliberto Sánchez Ramos 1,4*
Constanza Quiroga Moreno 1, Jorge R. Toledo Alonso 2,4, Claudio A. Zaror 3,
Frank Camacho Casanova 1,5, Oliberto Sánchez Ramos 1,4*
1 Recombinant Biopharmaceuticals Laboratory, Department of Pharmacology, School of Biological Sciences, Universidad de Concepción, Concepción, Chile.
2 Center for Biotechnology and Biomedicine Spa, Concepción, Chile.
3 Department of Chemical Engineering, School of Engineering, Universidad de Concepción, Chile.
4 Biotechnology and Biopharmaceutical Laboratory, Department of Physiopathology, School of Biological Sciences, Universidad de Concepción, Concepción, Chile
5 Combinatorial Biology and Bioprocess Laboratory, Department of Pharmacology, School of Biological Sciences, Universidad de Concepción, Concepción, Chile.
+ Both authors contributed equally to this work
*Corresponding author: osanchez@udec.cl
ABSTRACT
A recombinant peptide as a TNF-blocking agent was obtained using fermentation in E. coli. The strategy was based on the expression of a multimeric tandem protein comprising 15 repeated copies of the r-CBB288 peptide, and the monomeric unit was released with a hydroxylamine-assisted proteolysis step. At this point, size exclusion chromatography was used to separate the monomer unit from unreacted polymer forms. Therefore, the main theme of this study was to develop a phenomenological General Rate Model to describe the elution profile of SEC and to ensure the required purity levels for the mentioned peptide. In that sense, with the development of the phenomenological model, it will be possible to design different process scales of desired dimensions further. For such purpose, the reproducibility of the SEC was determined on a lab scale, and phenomenological coefficients were calculated from mathematical correlations and simulated in the Matlab software. For the validation of the mathematical model, a DoE (23 with central point) was performed, where the sample load, velocity, and bed height were assessed as independent variables, whereas 99% purity and operating time were response variables. As the main results, simulated profiles did not show statistical differences (residual ≤ 5%) concerning experimental profiles. This study introduces a validated phenomenological model for SEC applied to purifying a TNF-blocking peptide, integrating computational simulations with experimental validation, enabling reliable process scale-up for industrial bioprocess design. In conclusion, it was possible to develop a phenomenological model of the SEC to ensure the purity of the antiTNF recombinant prototype at different scales, which allows the designing of industrial processes at scales of desired dimensions.
Keywords: size exclusion chromatography, phenomenological model, TNF blocking agent, peptides, bioprocess modeling, in silico simulation, scale-up
INTRODUCTION
Size exclusion chromatography (SEC) remains a cornerstone technique in the downstream processing of biopharmaceuticals, particularly for the purification of peptides and proteins due to its non-denaturing nature and ability to preserve bioactivity 1-4. However, despite its widespread use, the design and optimization of SEC processes still rely heavily on empirical approaches, especially when applied to novel therapeutic targets such as TNF-blocking peptides 1, 3, 6-10. This lack of predictive tools hinders efficient process scale-up and increases development costs and timelines.
The recombinant peptide r-CBB288, investigated in this study, targets tumor necrosis factor (TNF), a cytokine heavily implicated in the pathogenesis of autoimmune and inflammatory diseases such as rheumatoid arthritis, Crohn's disease, ulcerative colitis, and psoriasis. TNF inhibitors are among the most prescribed biologics globally, underscoring this therapeutic class's medical and commercial relevance 12,15.
From a biotechnological perspective, the production and purification of recombinant anti-TNF agents require robust and scalable purification strategies. In this context, developing a phenomenological model for SEC enhances understanding of mass transfer phenomena and enables in silico simulation and prediction of chromatographic behavior across scales, streamlining downstream process development. Such mechanistic models are especially critical for regulatory environments that demand consistency, robustness, and reproducibility in biologics manufacturing 1, 9, 11.
Recent advances in computational chromatography have demonstrated the potential of digital twins and mechanistic modeling to bridge the gap between lab-scale experiments and industrial applications 20, 18, 19. This study aligns with that trend by presenting a validated, scalable SEC model tailored to a novel peptide therapeutic, offering a powerful tool for rational bioprocess design in the era of precision biologics.
TNF is a protein related to the immune response and inflammation, which is important for the body's defense. However, there are pathological conditions related to high levels of TNF that have been associated with several human diseases, including rheumatoid arthritis, psoriasis, ankylosing spondylitis, psoriatic arthritis, juvenile idiopathic arthritis, inflammatory bowel diseases such as Crohn's disease and ulcerative colitis and cancer 12-15.
However, no mathematical model capable of describing the existing operation for this chromatographic step has been developed so far. Therefore, the study's main aim was to create a phenomenological model of the SEC for purification of r-CBB288 representative of the operation at different scales, which allows designing industrial process scales of desired dimensions from a general mathematical rate model.
MATERIAL AND METHODS
The product results from the proteolysis step with hydroxylamine (300 mL), with 84% cleavage efficiency and low recovery for 99% purity required.
Reagents
Water for injection, sodium dihydrogen phosphate (Merck, Germany), sodium hydrogen phosphate (Merck, Germany), acetone (Merck, Germany).
Buffers
Buffer A: 0.2 mol/L NaH2PO4; Buffer B: 0.2 mol/L Na2HPO4; 0.01 mol/L sodium phosphate, pH7; 0.2 mol/L NaOH, acetone at 2%.
Tris Tricine SDS-PAGE
The elution product was analyzed by Tris Tricine electrophoresis (4%T, 3%C for concentrator gel, 10%T, 3%C for spacer gel and 16.5%T, 6%C separator gel) (16) to verify the release of the monomeric unit of the tandem protein.
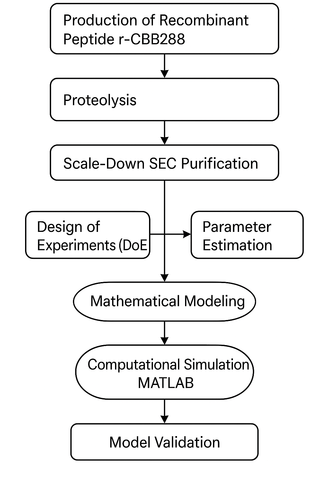
Schematic representation of the methodological workflow employed in this study, encompassing recombinant peptide production, proteolysis, scale-down size exclusion chromatography (SEC), design of experiments (DoE), parameter estimation, phenomenological modeling, and computational simulation in MATLAB, leading to model validation through comparison with experimental chromatographic profiles
Equation System for Mass Balance in SEC 1, 9
The equation system of the general mathematical model for SEC is described below, where the equations are formulated from the differential mass balance for a solute in the mobile phase.
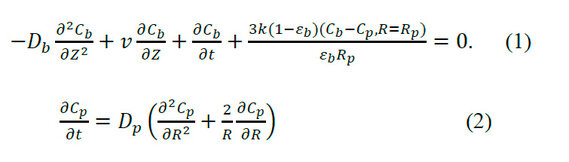
Where: Db is the axial dispersion coefficient (m2/s), Cb is the concentration of a solute throughout the mobile phase, Cp is the concentration of a solute in the entire stagnant phase within the macropores, Z is the axial coordinate of the column in cylindrical coordinate system, k is the mass transfer film coefficient, εb is the dead volume fraction of the bed, Dp expressed in (m2/s) is the effective diffusivity within the macropores of the particle, R is the radial coordinate for a particle in a cylindrical coordinate system, Rp is the radius of the particle and t is the time.
Non-dimensional terms introduced in the equations of the general mathematical model for SEC:
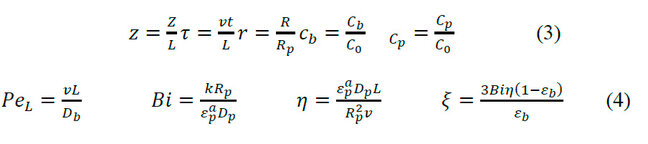
Where: L is the length of the packed column (m), τ is the dimensionless time, v represents the interstitial velocity (m/s), C0 is the initial solute concentration, PeL is the Peclet number, Bi is the Biot number, represents the accessible porosity of the particle, η, and ξ are non-dimensional terms that relate to the coefficients described.
Equations 1 and 2 of the general mathematical models for SEC transformed with the respective dimensional terms:
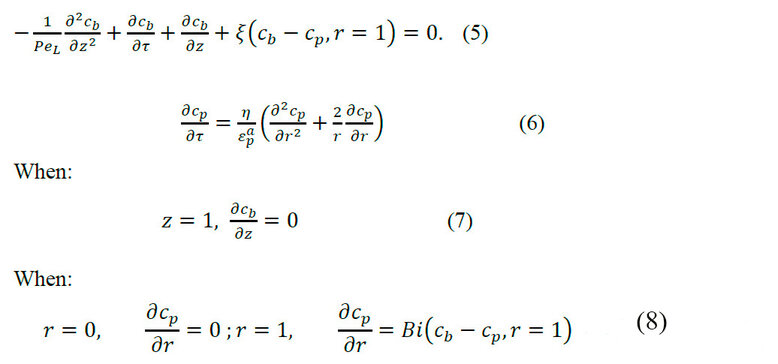
The non-dimensional partial differential equations system is solved numerically using a computational simulation package. The model system is expressed for a solute.
SEC model parameters 9, 10
The input data for the model include the dimensionless impulse feeding time (τimp), particle porosity (εp), bed dead volume fraction (εb), Peclet number (PeL), number η, The Biot number (Bi), the maximum concentration (C0, is the feed concentration for single column operations), and the size exclusion factor (Fex).
Bed dead volume fraction (εb):
The value of εb depends on the size of the resin particles and the packaging process. The parameter εb is treated as a constant for different columns with the same packing material and is obtained from:
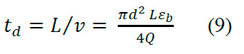
Where: td is the retention time of a large molecule excluded by macropores, td is also known as dead volume time.
Particle porosity (εp):
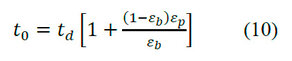
The value of εp can be calculated from the retention times of a small molecule whose size is smaller than the low exclusion limit of the porous particles. The relation between the retention time of a small solute (t0) and εp is shown in equation (10).
Accessible porosity of the particle ()
The accessible porosity of the particle represents the accessible macropore volume fraction (relative to the total particle volume) for a particular solute. The value for a typical macromolecule as a protein is less than the εp. If a macromolecule has = 0, it means that the pores completely exclude it. The A solute's value differs from another solute's; this is the key factor responsible for separating molecules in SEC. The value of A solute can be obtained with the tR, as shown in equation 11.
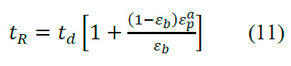
Where:is the retention time of a molecule not excluded by the macropores andis the accessible porosity of the particle for a solute.
The value of PeL represents the magnitude of the axial dispersion. When PeL tends to infinity, the axial dispersion becomes negligible, indicating a piston flow. When PeL exceeds 1000, its influence on peak width is insignificant. According to the definition (PeL = vL / Db), this value is calculated from the coefficient of axial dispersion (Db). The value of Db is not easy to measure experimentally. PeL is calculated according to the correlation for a fixed bed,

Where: Re is the Reynolds number and is calculated (2Rp) vρ / μ)
The value of the effective diffusivity is necessary to calculate the value of η according to equation (6). Dp affects the width of the peaks in the chromatograms. Dp is obtained by the molecular diffusivity (Dm) with the following correlation:
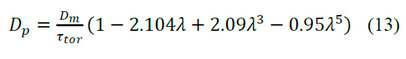
Where: is the ratio of the diameter of the molecule to the diameter of the pore, is calculated according to equation 17
Large Dp values provide sharp peaks. A low value of λ implies a large diameter pore of the packing particle. Thus, a large pore size results in sharp peaks. However, pore size selection also rests on pore size's effectiveness in discriminating between different molecules-solutes to be separated. In a general model with an assumed value of τtor, Dp is calculated, and since this is a particle-specific parameter, it can be used in large and small columns for the same protein. The molecular diffusivity (Dm) of large spherical molecules is given by the Stokes-Einstein equation.
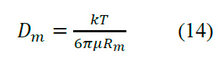
Where: kis the Boltzmann constant, T is the absolute temperature, Rm is the molecule's radius.
The radius of a molecule is obtained from the specific volume (vs) and its molecular size (MW) with the requirement that the protein is spherical:
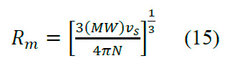
According to Gu 1, the vs values for proteins are in a range of 0.728 ~ 0.751. The average value is 0.7384. The proteins in the solution are hydrated, which increases their sizes. If the hydrodynamic radius is assumed proportionally for MW1/3then,
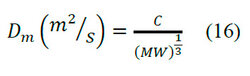
Equation (16) sets experimental data for some organic substances, including proteins. With values of C that average with small deviation for proteins with MW (molecular size) greater than 1000 Da. The manufacturer provides the pore diameter (dp) of the resin. If not, an approximation for the pore diameter of the resin is obtained by the limit of exclusion of the resin. For polymers, the value of λ is a function of the molecular size of a solute.
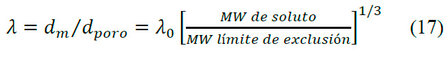
Where: dm and dporo are the diameters of a molecule and pore, respectively
λ0 = 0,35 to assume that when the solute diameter has a MW of 35% with respect to the exclusion limit's MW, the solute cannot penetrate the pore.
The Biot number (Bi) for mass transfer reflects the characteristic relation between the external film mass transfer rate and the intraparticular (within the particle) diffusion rate. Bi number is found from the effective diffusivity and the mass transfer coefficient. The value of Dp is calculated by equation (13). Under experimental conditions of an SEC, the Reynolds number is very small. Several correlations are used to estimate the value of k by the number of Sherwood (Sh). Equation (18) is the most convenient.
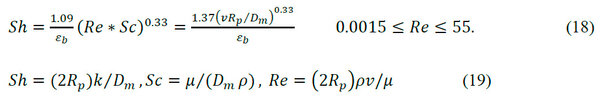
Where: Sh is the Sherwood number
After obtaining the value of Sh, the value of k is calculated as:
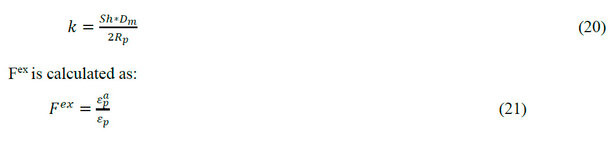
The Fex introduced by Gu has the same value as the distribution coefficient (KSEC). The separation capacity of a molecular exclusion column can be characterized by KSEC.
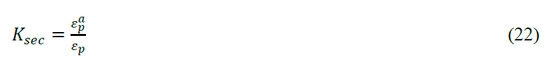
Then, Fex will have the same value as KSEC. Fex is calculated with εap and εp values.
Computational tools
Statgraphics Centurion XV. I (Statpoint Inc., Virginia, USA) and Matlab (MathWorks, Inc., USA) software were used to design experiments, statistical analysis, and chromatographic operations module simulators.
Methodology for calculation and estimation of model parameters
The primary model stage is obtained by introducing input parameters using data and measurements made in chromatography at the optimized laboratory scale with a factorial experimental design. The final model stage is obtained by adjusting and estimating the parameters of the primary model employing an analytical injection and installation dispersion modeling; the validation was carried out by comparing virtual runs with experimental runs.
RESULTS AND DISCUSSION
The development of phenomenological models for SEC performed to purify a CBB288 peptide could represent this operation at different scales, allowing designing processes to be done in the desired dimensions 3, 9, 17. It is important because the phenomenological models could allow extrapolation of their predictions towards different operation ranges, facilitating the design of SEC industrial scales based on non-empirical data. This study was performed using the SEC scaled-down version.
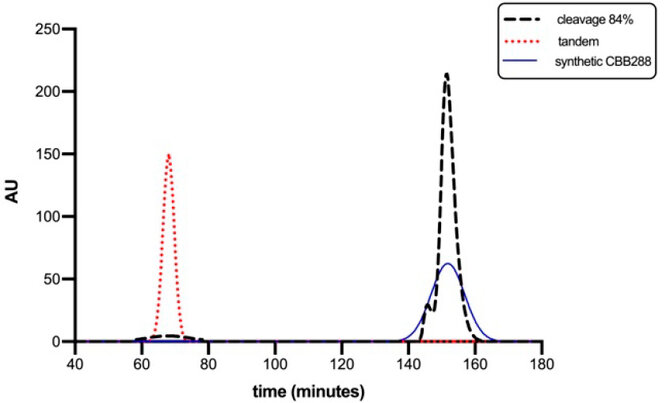
Figure 1. Unoptimized SEC elution profile using Shephadex G-25 Medium Chromatographic Resin (GE HEALTHCARE, USA) for the I sample from the proteolysis step. The blue profile corresponds to a synthetic prototype of the CBB288 peptide (~1.3 kDa) used as a positive control, the red profile represents the unreacted tandem protein (~25.3 kDa), and the black profile corresponds to proteolysis conditions for an efficiency of 84%.
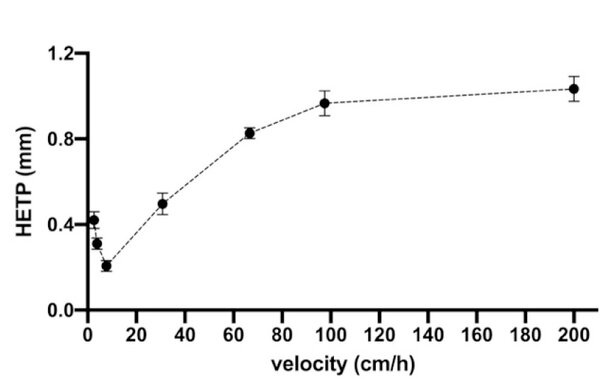
Figure 2. Graph representing the Van Deemter equation for Sephadex G25-Medium resin in the system.
Characterization of operating conditions and variables in SEC.
The relationship between the number of theoretical plates and flow was studied in the scale-down to know the region of the Van Deemter classic graph for this resin.
As can be observed in Figure 2 the behavior is like the classical predicted by the Van Deemter equation (HETP = A + B/v + C.v), with an optimum velocity of around 10 cm/h. The velocity used in the laboratory is 104 cm/h and is in the curve region influenced by resistance to mass transfer.
As can be observed in Figure 2 the behavior is like the classical predicted by the Van Deemter equation (HETP = A + B/v + C.v), with an optimum velocity of around 10 cm/h. The velocity used in the laboratory is 104 cm/h and is in the curve region influenced by resistance to mass transfer.
Given the need to explore various variables and their impact on the separation, the need to perform a scale-down of lower bed height, since the experiments could be performed reasonably and with a sample consumption that did not involve a serious economic affectation in experimentation 4. In addition, it was intended to perform phenomenological modeling of the chromatography, and this allowed the management of any scale of "in silico" simulations of the operation provided that its equivalence concerning the relation number of theoretical plates and bed height (HETP = 850,5 mm). An experimental design was performed to study the relationship between the fundamental operating variables and their impact on the recovery, resolution, and time of operation results. The height of the bed (h or Lc in cm), the sample load (% of column volume), and the velocity (cm/h) were studied. Good regression models were obtained for all the response variables studied. The influence of the different variables can be observed in Figure 3 and Figure 4.
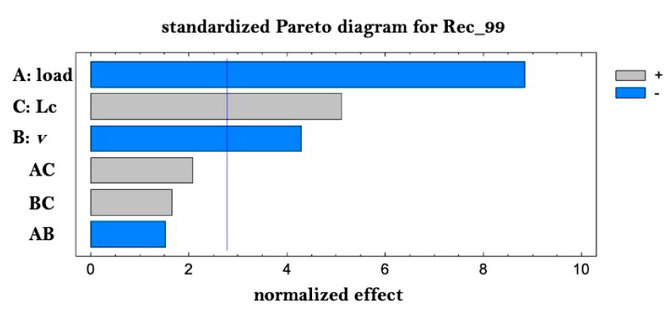
Figure 3. Pareto for recovery of Rec_99% (purity).
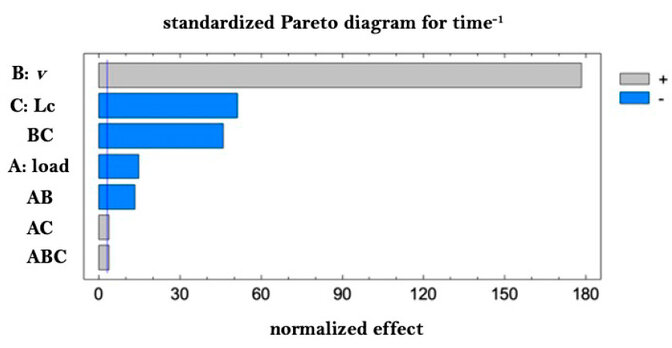
Figure 4. Pareto for recovery of time-1 (productivity).
Note that the load plays a fundamental and negative role in the purity/resolution, as the speed directly and positively influences the operating time. These aspects are known, but they show that the design achieved reproduces the conditions and their quantitative relation in the studied system. To obtain the best conditions of the chromatography, a desired function was defined where the recovery is maximized and the operating time is minimized, giving a greater impact to the recovery. It is important to note the importance of reducing the load when speed is increased, which is consistent with increased productivity but at the expense of a loss of chromatographic efficiency. In order to corroborate the model of the experimental design, the run suggested by the desired function was executed, and the response variables were calculated to compare them with those predicted by the model.
The best conditions provided by the desired function were a load of 18%CV, a velocity of 167.1 cm/h, and a bed height of Lc=14 cm. Figure 5A shows the results of the run, and as you can see, the response variables are well predicted. The chromatographic analysis shown in Figure 5B allows us to quantitatively determine the resolution of the system, which for the evaluated conditions turned out to be 0.9966; in turn, using the relationships of overlapping areas, a Rec_99 of 99.3% was estimated for peak 2, which was collected and applied in lane 1 of the SDS-PAGE Tris-Tricine gel shown in the Figure 5C, which makes it possible to verify that the purity analysis estimated utilizing the experimental graph was carried out specifically concerning the analyte of interest r-CBB288. As can be seen, the electrophoretic signal in lane one corresponding to the collection of peak 2 is at the same height as the syn-CBB288 positive control, indicating that the estimated analysis relative to the purity level describes the peptide of interest. To facilitate the analysis, the results are grouped in Figure 5D, and they suggest that the empirical model obtained by experimental design presents an acceptable prediction of the response variables studied for this purification system.
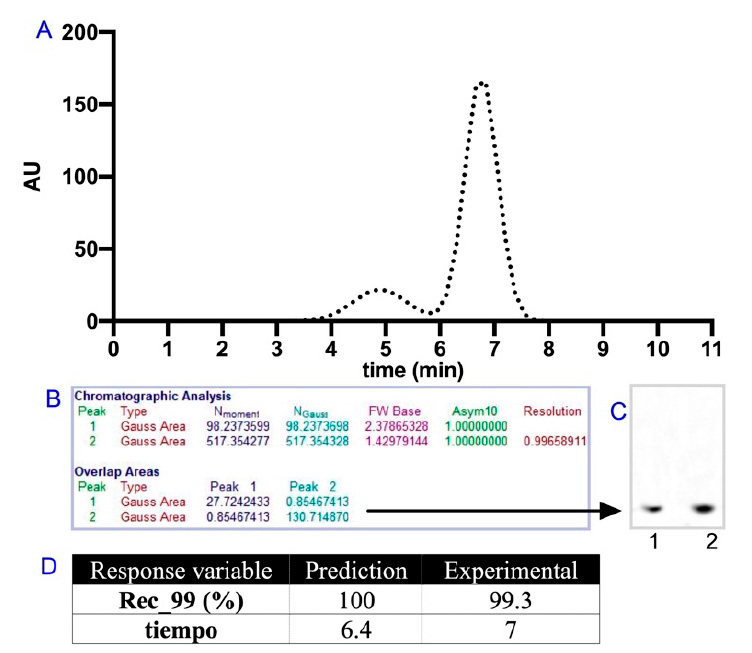
Figure 5. A: Experimental chromatographic profile suggested by the desire function; B: Chromatographic analysis to determine system resolution and purity of the r-CBB288 species; C: SDS-PAGE Tris-Tricine, lane 1: purified r-CBB288, lane 2: syn-CBB28 positive control; D: Response variable in prediction and experimental
Estimation of parameters for SEC simulation.
From the optimized elution profile of Figure 5A, the initial parameters of the general model were estimated.
The velocity values for micro solute (r-CBB288 peptide) and macro solute (unreacted forms) in the system were expected since it is logical that a macro solute that has little probability of entering the pores of the particle leaves the system much faster than a micro solute that penetrates completely the pores making a route more tortuous until the exit of the system. The literature indicates 1, 9 the possibility of estimating an initial value for the simulation of Ɛb = 0.4 when there are no experimental data; in this case, there were elution profiles that made it possible to determine, at least by correlation, the external porosity fraction, the result was Ɛb= 0.54. Regarding the fraction of internal porosity, Ɛp values greater than 0.66 9 have been reported; for the studied system, a Ɛp = 0.57 was obtained.
Reynold's number for this type of system includes an interval of 10-3 ~ 103, and the experimental calculated value is 0.09; this result allows us to use the correlation suggested by Li and Gu 1, 9 to determine the Peclet number. With PeL=307,57 an axial dispersion coefficient (Db according to Li) equal to 2.41.10-7 m2/s was determined. Db value is not easy to measure experimentally, and to ensure a correct estimation was also calculated using a correlation suggested by Schmidt 3, obtaining a coefficient equal to 9.03.10-8 m2/s. Both initial values are comparable and could be used for modeling, but considering that the axial dispersion term negatively influences the chromatographic resolution 6, it was decided to overestimate the model by selecting the highest axial dispersion, in this case, the one calculated from the Li correlation.
To avoid mathematical singularities during the modeling, the values of Fex were redefined to 1% and 99%, respectively, then a value of Ɛap for the macro solute equal to 0.0057 was obtained, which means that only 0.57% of the volume occupied by the pores inside the particle are intended for partitioning of the macro solute. It is evident that the value of Ɛap for a micro solute is much higher; in this case, Ɛap =0.5654, which means that approximately 56.54% of the sites destined for partitioning can be occupied by the micro solute 1,3,5. The latter is of great importance since it is directly related to the separation and resolution of the chromatographic system.
The film mass transfer coefficient result for the macrosolute (kmacrosolute=1.51.10-5 m/s) coincides with values reported for polypeptides with a molecular size greater than 5000 Da 1, 3, 9. However, there is no reference in the literature for a film mass transfer coefficient for an organic microsolute of the r-CBB288 type since it is a novel molecule; however, the calculated value was kmicrosolute=12.50.10-5 m/s. The experimental estimation of the coefficients is extremely difficult, but these can be adjusted by employing in-silico runs 9, 10. Given the comparison of the Dp coefficient for the microsolute (1.02.10-9 m2/s) with the coefficient kmicrosolute=12.50.10-5 m/s, even without adjusting, it can be speculated that the mass transfer is limited by diffusivity effective intraparticular.
Primary model stage.
To discretize the model equations, a finite element algorithm (with quadratic elements) and an orthogonal placement method were established 1, 3, 6, 13. The virtual profile of the primary modeling and the comparison with the experimental profile of Figure 5 can be seen in Figure 6. Although notable differences can be seen in the residue levels, the virtual profile obtained describes the optimized operation with acceptable equivalence.
The model was fitted to reduce errors in subsequent steps and obtain refined model parameters (Figure 6B). During the adjustment, the parameters and coefficients were not sensitive, which may be due to the simplicity of the strategy used. Well, the input values for the primary model were determined from the same experimental chromatogram for which the simulation was adjusted. However, it was possible to verify that the primary model is representative of the SEC operation, according to the graphic equivalence shown, but a more rigorous experimental strategy is required to refine the virtual parameters analytically.
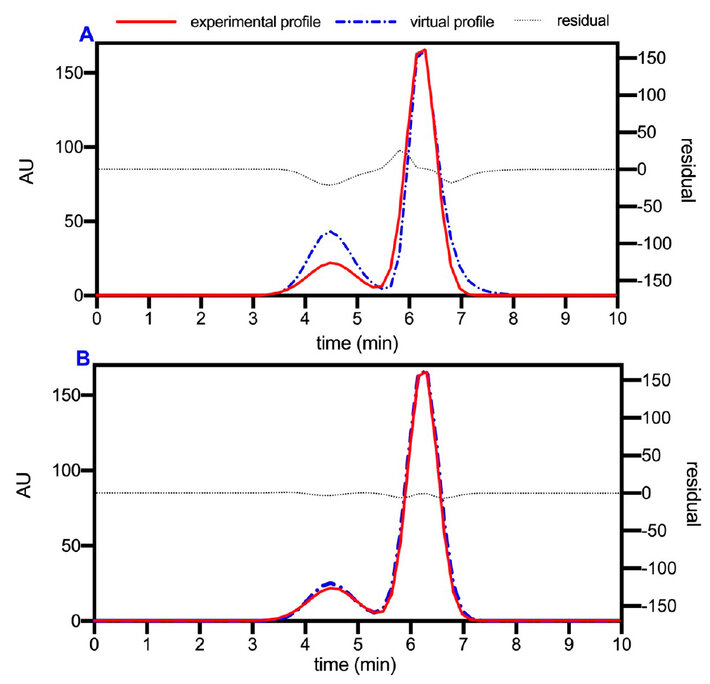
Figure 6. A, comparison of the virtual profile obtained in the primary modeling against the experimental profile optimized in the experimental design. B, virtual profile adjusted.
Table 1 compares our proposed model with other relevant SEC models in the literature, highlighting shared foundations and the novel contributions introduced in this study.
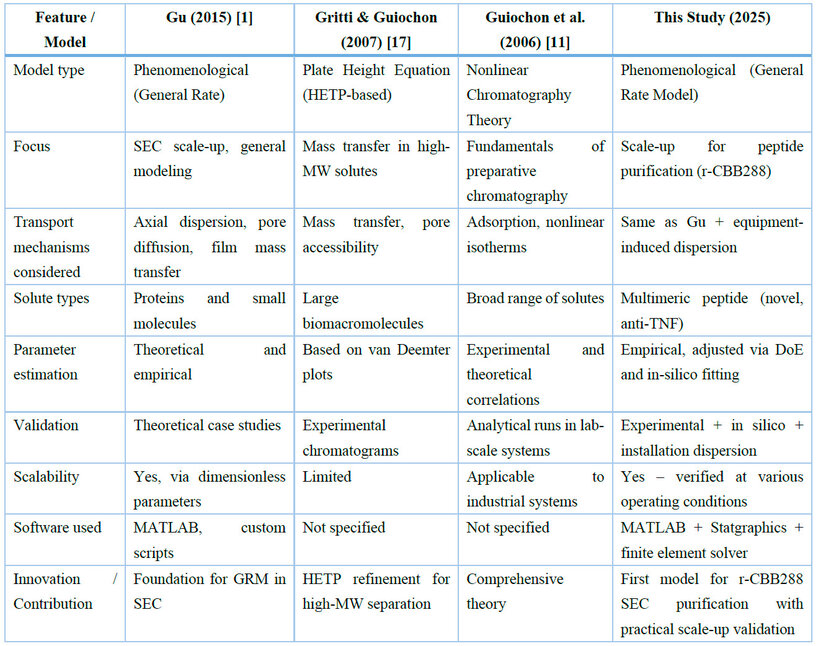
Table 1. A comparative overview of selected SEC models and the model proposed in this study is provided.
Final model stage.
To achieve rigor in the final adjustment of the model and to mitigate the experimental error implicit in the laboratory elution profiles, the net dispersion caused by the installation or plant (system without a chromatographic column) was determined, thus allowing the estimation of the retention more accurately.
As can be observed in Figure 7, there is some correspondence with little error between the actual dispersion profile caused by the installation and the simulation, which will allow a much more refined final model and thus be able to reach an overall adjustment of simulations that more accurately reproduce real cases of chromatographic runs. The dispersion of the installation and the discussed coefficients were integrated into the model for the final adjustment concerning an analytical run with a load reduction of 50%, a velocity of 110 cm/h, and a bed height of 14 cm. Figure 8 shows the experimental and simulated profiles with all the adjusted parameters.
As shown in Figure 8, there is no appreciable difference between both chromatographic profiles, so we can state that the adjusted model describes the characteristics of the operation for the conditions tested. Table 2 summarizes the parameters resulting from the final fit of the model.
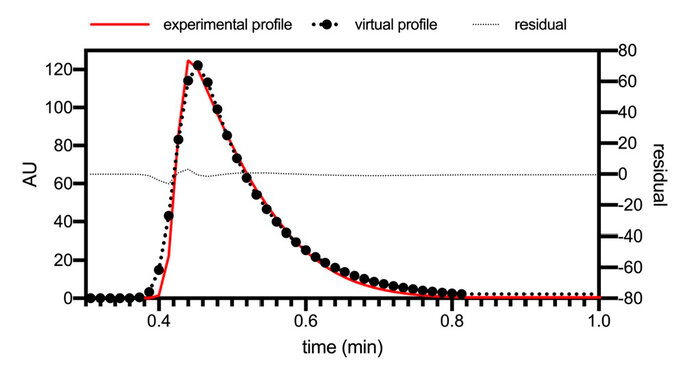
Figure 7. Comparison of the experimental profile of the dispersion generated by the installation and the virtual profile of the dispersion generated by the installation.
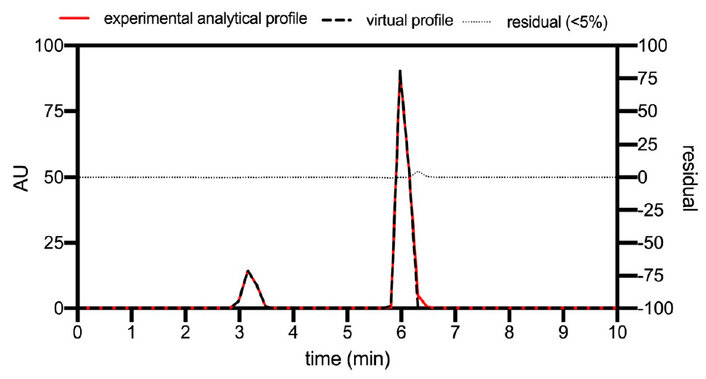
Figure 8. The experimental analytical profile (red line) and virtual profile adjusted to the analytical conditions (black line).
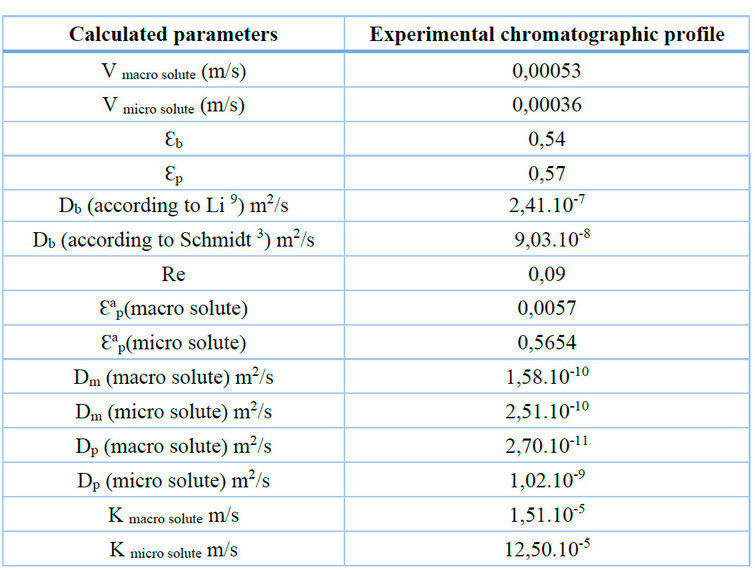
Table 2. Summary of calculated parameters for GRM model.
The sensitivity of some parameters during the adjustment seems to be promoted by the integration to the model of the real dispersion caused by the installation, observing the decrease of Ɛb and the increase of Ɛp with the primary model that was adjusted to the experimental profile of Figure 6B without contemplating the extra dispersion. The Ɛap for both the macro and micro solute is related to the Ɛp coefficient, through which the Fex parameter was also refined for both components, initially introduced to the model with a considerable error. As mentioned, the analytical injection favored efficiency by decreasing the load and velocity, previously analyzed in the DoE and the Van Deemter plot. Obtaining sharper peaks coincides with the increase in PeL, which is inversely proportional to the axial dispersion. The Db coefficient before the adjustment (2,41.10-7m2.seg-1) was estimated from the Li correlation, and the final fitted was 8,77.10-8m2.seg-1, coinciding with the initial estimation made from Schmidt's correlation (9,03.10-8 m2.seg-1).
The least sensitive parameters to optimization were Dp and the coefficient k(macrosolute), possibly due to the low possibility of penetrating the particle. The low sensitivity of Dp for the microsolute may be related to the parameter τtor, since estimating the tortuosity of a pore is not easy to measure experimentally 5, 6, 13. During the adjustment, the Dm was not sensitive either, which suggests a correct initial estimate of the parameter.
However, the results point to a correct estimation of the coefficient k (microsolute), according to the degree of separation and chromatographic resolution achieved, even in the primary stage when some parameters were not accurately estimated. This is consistent because throughout the modeling process, the Dp and k values for the microsolute indicate that the greatest resistance to mass transfer occurs during the intraparticle diffusion steps 1, 3.
The developed model can generally describe the profiles with minimum error, but it must be corroborated in other operating intervals and extreme conditions not explored during the mathematical modeling.
Validation of the model.
Virtual profiles were compared to real profiles corresponding to different conditions of the DoE discussed. As can be shown in Figure 9, the adjusted final model describes the behavior of the chromatography under various operating conditions. In the cases shown, extreme conditions tested in the DoE were selected. This ensures that the model correctly describes all the tested conditions and even the untested conditions external to this experimental virtual space.
As can be seen, the final model describes the behavior of the chromatographic separation for the peptide species involved in different operating conditions with low error. This is extremely important since, being a phenomenological model, it allows its predictions to be extrapolated towards dissimilar regions of operation.
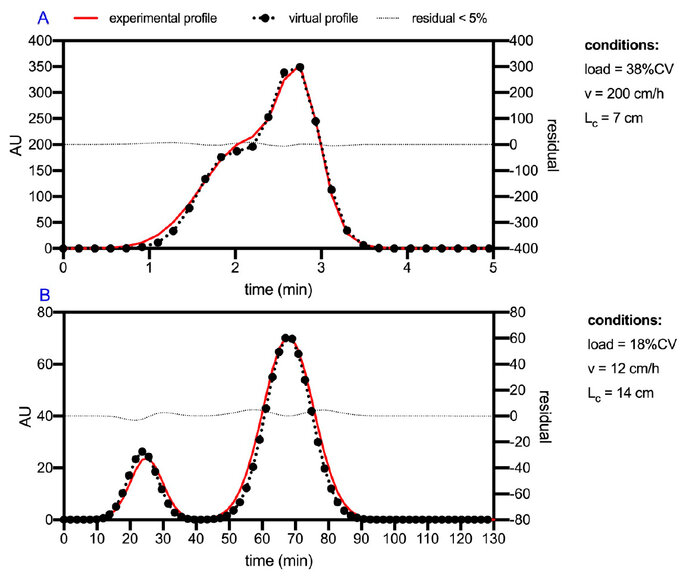
Figure 9. Comparison of virtual and experimental profiles for two runs of the DoE. (A) Run for a bed height of 7 cm, with a 200 cm/h velocity, and load 18% of column volume. (B) Run for a bed height of 14 cm, with a 12 cm/h velocity and a load of 38% of column volume.
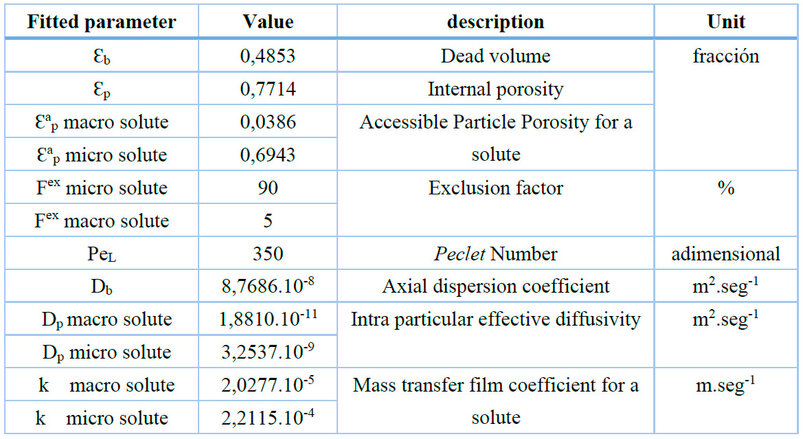
Table 3. Parameters resulting from the adjustment of the model using chromatography with analytical injection and integration of the dispersion of the installation.
In summary, integrating experimental design, detailed transport modeling, and computational simulation enabled a robust characterization of the SEC process for purifying the r-CBB288 peptide. The close agreement between simulated and experimental elution profiles under various operating conditions validates the reliability of the proposed phenomenological model. Beyond its predictive capacity, the model offers a mechanistic understanding of chromatographic behavior, making it a valuable tool for informed decision-making during process development. These findings reinforce the importance of combining empirical optimization with first-principles modeling to achieve scalable and efficient purification strategies in biopharmaceutical applications.
CONCLUSIONS
A good fit is obtained between the experimental profiles and the modeling of the elution profiles, suggesting that it is possible to use the model to describe protein elution profiles in SEC for a similar system and even reproduce conditions external to this experimental space. On the other hand, a dynamic phenomenological model is developed for the SEC operation that reproduces the behavior at different scales and allows the design of productive scales of desired dimensions. A phenomenological model is developed for the SEC operation to reproduce the behavior at different scales and will enable the design of productive scales of desired dimensions.
This study successfully developed and validated a dynamic phenomenological model for size exclusion chromatography (SEC) to purify a recombinant TNF-blocking peptide (r-CBB288). The model was grounded in mass balance equations and physicochemical transport parameters, and its predictive accuracy was confirmed by comparing simulated and experimental elution profiles under various operating conditions.
One of this work's key innovations is the integration of installation-induced dispersion and analytical injection data into the modeling framework, which allowed a refined calibration of the model's parameters. Unlike empirical approaches, this phenomenological model provides mechanistic insight into solute transport phenomena, enabling accurate simulation of chromatographic performance across scales.
Moreover, the study demonstrated that the model can reproduce elution behavior not only within the boundaries of the experimental design but also under extrapolated conditions, which is critical for process scale-up and industrial implementation. This capability represents a significant advancement in the rational design of chromatographic processes for biopharmaceutical applications.
In summary, the model developed in this work serves as a versatile and scalable tool for streamlining SEC-based purification processes for novel therapeutic peptides, bridging the gap between laboratory-scale development and industrial manufacturing.
Funding: This work was financed by the Corporación de Fomento de la Producción (CORFO). Project id: 16IDAE-67705.
Acknowledgments: We would like to thank the Agencia Nacional de Investigación y Desarrollo (ANID) for the national doctoral grant, folio 21190119, which supported Pedro P. Aguilar and the Corporación de Fomento de la Producción (CORFO) for funding this work.
Conflicts of Interest: The authors declare no conflict of interest
REFERENCES
1. Gu T. Mathematical Modeling and Scale-Up of Liquid Chromatography: With Application Examples: Springer; 2015 2015/04/06/. 214 p.
2. Maqsoudlou A, Mahoonak AS, Mora L, Mohebodini H, Toldra F, Ghorbani M. Peptide identification in alcalase hydrolysated pollen and comparison of its bioactivity with royal jelly. Food Research International. 2019;116:905-15.
3. Preparative Chromatography of Fine Chemicals and Pharmaceutical Agents. Oxford: Blackwell Science Publ; 2006 2006.
4. Harrison RG, Todd P, Rudge SR, Petrides DP. Bioseparations Science and Engineering: Oxford University Press; 2015 2015. 577 p.
5. Jagschies G, Sofer GK, Hagel L. Handbook of Process Chromatography: Development, Manufacturing, Validation and Economics: Elsevier; 2007 2007/12/08/. 383 p.
6. Zelic B, Nesek B. Mathematical Modeling of Size Exclusion Chromatography. Eng Life Sci. 2006;6(2):163-9.
7. Faraji N, Zhang Y, Ray AK. Impact of operating conditions on chromatographic column performance: experimental studies on adsorption of high-value minor whey proteins. AIMS Bioeng. 2017;4(2):223-38.
8. Chester TL. The combination of partition, size exclusion, and hydrodynamic models in chromatography, and application to bonded phases on porous supports. Journal of Chromatography A. 2020;1620:461011.
9. Li ZG, Gu YS, Gu TY. Mathematical modeling and scale-up of size-exclusion chromatography. Biochemical Engineering Journal. 1998;2(2):145-55.
10. Pavlov G, Hsu JT. Modelling the effect of temperature on the gel-filtration chromatographic protein separation. Computers & Chemical Engineering. 2018;112:304-15.
11. Guiochon G, Felinger A, Shirazi DGG. Fundamentals of Preparative and Nonlinear Chromatography: Elsevier; 2006 2006/02/10/. 991 p.
12. Reinglas J, Lorant Gonczi ZK, Bessissow T, Lakatos PL. Positioning of old and new biologicals and small molecules in the treatment of inflammatory bowel diseases. World Journal of Gastroenterology. 2018;24(32):3567.
13. Richmond V, M Michelini F, A Bueno C, E Alche L, A Ramirez J. Small molecules as anti-TNF drugs. Current Medicinal Chemistry. 2015;22(25):2920-42.
14. Li P, Zheng Y, Chen X. Drugs for Autoimmune Inflammatory Diseases: From Small Molecule Compounds to Anti-TNF Biologics. Frontiers in Pharmacology. 2017;8.
15. Kalliolias GD, Ivashkiv LB. TNF biology, pathogenic mechanisms and emerging therapeutic strategies. Nature Reviews Rheumatology. 2016;12(1):49-62.
16. Schägger H. Tricine–SDS-PAGE. Nature Protocols. 2006;1(1):16-22.
17. Gritti F, Guiochon G. Application of the general height equivalent to a theoretical plate equation to size exclusion chromatography. Study of the mass transfer of high-molecular-mass compounds in liquid chromatography. Anal Chem. 2007;79(8):3188-98.
18. Chester TL. The combination of partition, size exclusion, and hydrodynamic models in chromatography... J Chrom A. 2020;1620:461011.
19. Pavlov G, Hsu JT. Modelling the effect of temperature on gel-filtration chromatographic protein separation. Comput Chem Eng. 2018;112:304–15.
20 Faraji N, Zhang Y, Ray AK. Digital twins in chromatography: predictive modeling in bioseparation process optimization. AIMS Bioengineering. 2021;8(2):223-240.
Received: April 14, 2023 / Accepted: February 25, 2025 / Published: June 15, 2025
Citation: Aguilar Domínguez P P, Reyes López F, Contreras Vera M A, Quiroga Moreno C, Toledo Alonso J R, Zaror C A, Camacho Casanova F, Sánchez Ramos O. Development and Validation of a Phenomenological Model for Scalable Size-Exclusion Chromatography in TNF-Blocking Peptide Purification. Bionatura journal. 2025;2 (2):2. doi: 10.70099/BJ/2025.02.021.2
Additional information Correspondence should be addressed to: osanchez@udec.cl
Peer review information. Bionatura thanks anonymous reviewer(s) for their contribution to the peer review of this work using https://reviewerlocator.webofscience.com/
ISSN.3020-7886
All articles published by Bionatura Journal are made freely and permanently accessible online immediately upon publication, without subscription charges or registration barriers.
Publisher's Note: Bionatura Journal stays neutral concerning jurisdictional claims in published maps and institutional affiliations.
Copyright: © 2025 by the authors. They were submitted for possible open-access publication under the terms and conditions of the Creative Commons Attribution (CC BY) license (https://creativecommons.org/licenses/by/4.0/).
How to cite this article:
Aguilar Domínguez P.P., Reyes López F., Contreras Vera M.A., et al. Development and Validation of a Phenomenological Model for Scalable Size-Exclusion Chromatography in TNF-Blocking Peptide Purification. BioNatura Journal. 2025; 2(2):2. DOI: 10.70099/BJ/2025.02.02.2