
Fighting moniliasis in Orellana with sensors and PWA for sustainable agriculture

Jessica Urquizo1*, Mirtha Jiménez 2, Pedro Aguilar 3, Wilson Chango4
1 University Escuela Superior Politécnica de Chimborazo sede-Orellana, Ecuador.
2 University Escuela Superior Politécnica de Chimborazo sede-Orellana, Ecuador.
mirtha.jimenez@espoch.edu.ec:
3 University Escuela Superior Politécnica de Chimborazo sede-Orellana, Ecuador.
pedro.aguilar@espoch.edu.ec:
4 University Escuela Superior Politécnica de Chimborazo sede-Orellana, Ecuador.
wilson.chango@espoch.edu.ec,
* Correspondence: jessica.urquizo@espoch.edu.ec
Available from. http://dx.doi.org/10.21931/BJ/2024.01.01.5
ABSTRACT
The primary objective of this research was to enhance cocoa production and quality in tropical countries, such as Latin America and Africa, where cocoa cultivation plays a pivotal role in the economy of rural communities. The primary challenge addressed in this study was moniliasis, a fungal disease that affects cocoa fruits and leads to a significant decline in crop production and quality. A multidisciplinary approach was employed to tackle this issue, combining sensors, MongoDB Compass databases, Progressive Web Applications (PWAs), and predictive models.
A research methodology incorporating predictive analysis techniques, particularly the logistic regression method, was utilized to achieve early detection and efficient management of moniliasis. Data collection instruments included sensors monitoring vital environmental factors like humidity and temperature alongside MongoDB Compass databases for storing and managing the gathered data. Furthermore, a PWA was developed for real-time data collection and analysis.
The results of implementing this sensor-based tool in cocoa cultivation were highly effective. Early detection of moniliasis allowed for more precise preventive and corrective measures, resulting in a significant improvement in cocoa production and quality. These results were substantiated with concrete data demonstrating the tool's efficacy.
Keywords. Data Prediction: Models and Applications; Efficient MongoDB Database Management; High-Quality Cocoa; Moniliasis: Treatment and Prevention; Progressive Web Apps (PWA): User Experience.
INTRODUCTION
Cocoa cultivation is of vital economic importance in many tropical countries and is an essential source of income in rural areas of Latin America and Africa. However, this valuable crop faces several problems that affect the quality and quantity of the harvest. One of the main problems confronting cocoa production is moniliasis, a fungal disease that affects cocoa beans and causes a drastic drop in yield and quality. 1
Moniliasis is a severe threat to the cocoa industry, and early detection of the disease is essential to prevent its rapid spread and minimize its negative impact on production. Currently, many cocoa farmers resort to periodic visual inspections to detect the presence of moniliasis in their plantations. However, this manual method can be time-consuming and error-prone, costing growers much time and money. To effectively solve this problem and reduce the waste of time and money associated with candidiasis,2. We have developed a real-time monitoring system with sensors and an advanced web application (PWA). These sensors collect accurate real-time data on key environmental factors that affect cocoa growth, such as humidity and temperature. The accumulated information is transferred to a central database where predictive models are implemented to determine the crop's presence or probability of diseases.3
Implementing this monitoring and forecasting system is an essential advance in sustainable agriculture, as it allows farmers to quickly detect candidiasis in plantations and take preventive measures in time. Preventing further spread of the disease can reduce economic losses and optimize farming methods.4
As direct beneficiaries, we will have the farmers of the Province of Orellana and the people interested in taking care of their cocoa plantations since, through the respective analysis, we will obtain predictions about our plantation, and in this way, we will be able to intervene and avoid the loss of time and money of the farmers.5
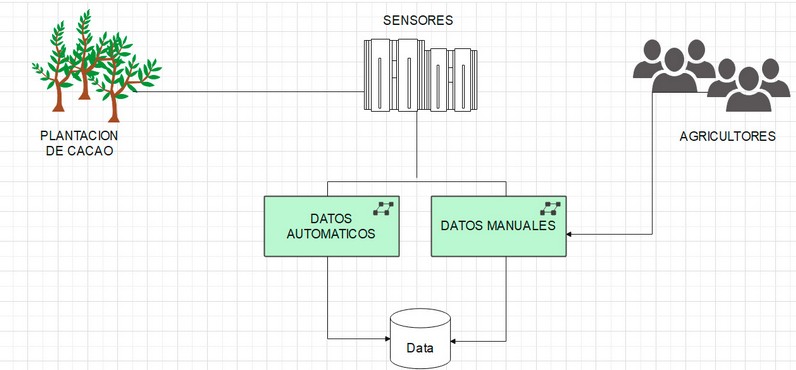
Figure 1. This figure shows the Project Model.
FUND
Cocoa quality is a crucial issue affecting chocolatiers and producers, and its improvement significantly impacts the entire supply chain.
As technology advances and the amount of available data grows, there is increasing interest in applying data analytics algorithms, especially machine learning, to solve complex problems such as forecasting and improving cocoa quality. These algorithms make it possible to analyze large amounts of data and discover patterns, trends and correlations that can be difficult to identify with traditional methods.
In this context, we developed an innovative cocoa quality prediction and monitoring system using advanced web applications (PWA) and advanced algorithms such as principal component analysis (PCA) and kernel PCA (KPCA). PWA provides an easy-to-use and accessible interface that allows farmers and producers to access valuable information in real-time and visualize relevant data on key environmental factors affecting cocoa quality.
A deeper insight into variables affecting cocoa quality is gained by integrating PWA's machine learning algorithms, such as PCA and KPCA. These algorithms can process complex data and discover subtle patterns that contribute to the quality of the final product. In this way, users can obtain accurate forecasts of cocoa quality to make informed and proactive decisions to improve production and processing. Implementing this monitoring and forecasting system should benefit farmers and chocolate producers. Farmers can optimize their growing and harvesting practices by adapting to environmental and cultural factors to improve cocoa quality at the origin. Manufacturers can use the predictive information to adjust their production processes and ensure high-quality cocoa beans for premium chocolate.
In addition, the system can potentially strengthen the global cocoa industry by increasing productivity and competitiveness. Sustainable growth and recognition of excellent cocoa produced in different parts of the world is facilitated by access to high-quality products that meet consumer demand.
Ultimately, combining advanced technologies such as PWA and machine learning algorithms with a focus on improving cocoa quality is a significant step forward in achieving sustainable agriculture and a more sustainable, efficient, and profitable chocolate industry. This monitoring and forecasting system opens a new era in cocoa farming and producing high-quality chocolate.
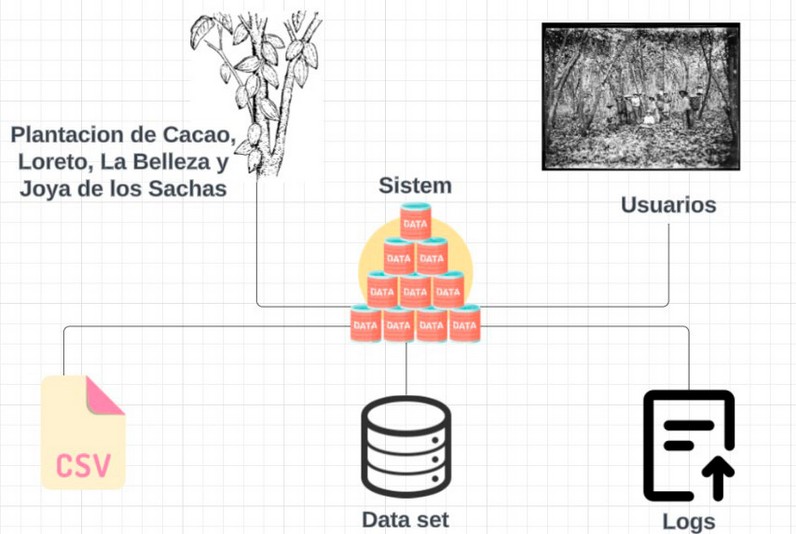
Figure 2. The figure represents data collection.
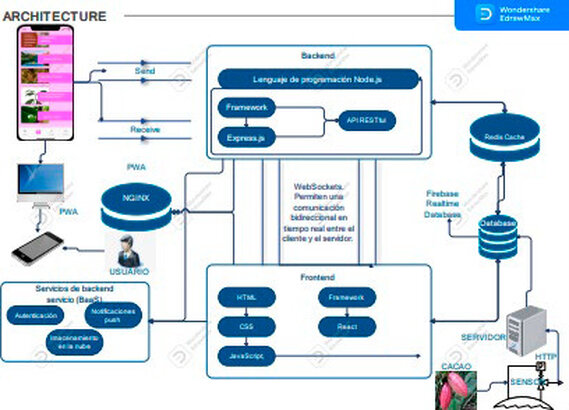
Figure 3. This figure represents the project architecture.
MATERIALS AND METHODS
This section describes the procedures and methodologies used to obtain the results and the resources employed in the study. The techniques and instruments utilized, the statistical methods applied and the criteria for selecting the population and the sample are detailed.
Definition of moniliasis
Monilia, also known as distemper, pasmo, tomato blight, or ice pod rot, is a fungal disease that affects various crops, including tomatoes, strawberries, pineapple, and potatoes. It is caused by the fungus Moniliophthora roreri and is spread through spores carried by wind or water. In addition, it is considered the central disease affecting cocoa crops in Colombia and other Central and South American countries,6.
Python
According to Challenger-Pérez, 7, Python is a programming language recognized for being interpreted at a high level, standing out for its simplicity and ease of reading. In addition, it is considered a versatile language with a wide range of applications.
PWA
A PWA, or Progressive Web Application, is a technology based on the conventional web and uses browser resources and modern APIs to enhance the user experience. Some of its features include the ability to run offline, update automatically, access device resources, and be installable, among other advantages, 8.
MongoDBcompas
MongoDBcompas is a desktop application provided by MongoDB that is used as a graphical user interface (GUI) tool for interaction with MongoDB databases. Its primary purpose is facilitating the administration and exploration of data stored in a MongoDB database, 9.
Definition of sensor
A sensor is an element or device that can detect or measure a specific physical or chemical phenomenon and transform that information into a signal or data that can be exploited practically. Sensors are essential components in electronic systems used in various industries, such as automotive, consumer electronics, medical industry, agriculture, and others, to cover a wide range of applications, 10.
Variable
An investigation can quantify or measure a characteristic, quality or observed property known as a variable, which can acquire various values, 11.
Methodology
This section describes in detail the procedure carried out to obtain the results and the resources used in the study. The procedures and methodologies followed are presented in chronological order of realization, and the techniques and instruments used are detailed to allow their reproduction.
In this way, it is shown that to prevent and control diseases such as cocoa moniliasis, several technologies have been developed, including sensors and mobile applications. The sensors measure environmental variables such as soil moisture, temperature, and luminosity. These data are transmitted through a wireless network to a Progressive Web App (PWA), which collects and analyzes the information in real-time.
Data description
Users (farmers) of cocoa from the canton Loreto, La Belleza and La Joya de los Sachas, province of Orellana, a database is generated from two sources of information; the data that we consider manual are those that the user (farmer) will add depending on the characteristics or data presented by his crop. The other automatic data are regarded as such because they are obtained by sensors that automatically capture accurate data.
We have collected the cocoa plantation data based on the above: manual data by the user (farmer) and automatic data by sensors that automatically capture data.
- Precipitation: Data obtained through a sensor, depending on the climate and the season in which the crop is located.
- Temperature: Data obtained daily from a sensor depending on the weather conditions.
- Relative Humidity (RH): The relative humidity data, a crucial environmental metric, requires further elucidation in the data description. RH is assessed through specialized sensors capable of gauging the humidity levels in the air.
- Dew point: Data obtained by the sensor from the measurement of the temperature at which the air becomes saturated with water vapor, meaning that the amount of water vapor in the air reaches its maximum and can begin to condense in the form of water droplets.
- Wind speed: Data obtained from sensors that measure the magnitude of the speed at which air moves in each direction. It is usually calculated in units of speed, such as meters per second (m/s), kilometers per hour (km/h) or miles per hour (mph).
- Gust speed: Obtained by the sensor, it is obtained when there is a sudden and temporary increase in wind speed compared to the average wind speed during a given period.
- Wind direction: Data obtained by the sensor based on the direction from which the wind is coming at a given place and time.
- Fruit: This data is considered manual since it is obtained by the farmer who will provide us with the data related to the production of his plantation.
- Incidence: This data is considered manual and relevant since the farmer provides us with approximate assessments of the incidence in the plantation through visual observation, where he compares the areas with different levels of shade and sun exposure and can provide us with an idea of the variations in the incidence of light in various parts of the plantation.
- Severity (%): This is considered manual, as the user uses a qualitative scaling technique to assess the severity of plant damage visually. A score or category is assigned to indicate the severity level, either in terms of percentage of damage, area affected or symptom severity. For example, a scale of 1 to 5 may be used, with 1 indicating no damage and 5 indicating severe damage.
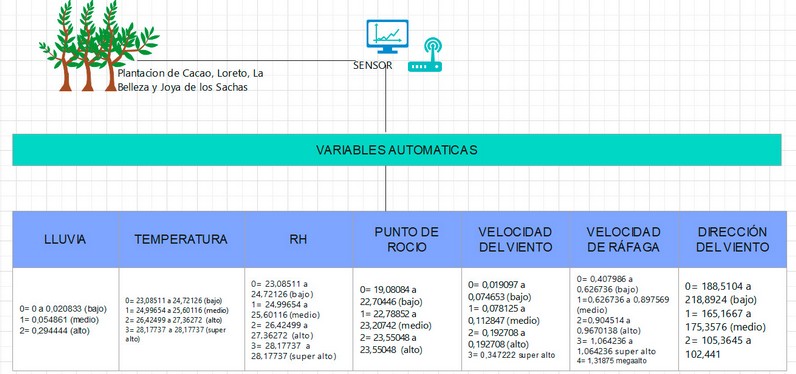
Figure 4. This figure shows the automatic variables to obtain the best prediction algorithm.
The data obtained automatically by the climatological measurement sensors are numerical values ranging from 0 to 102,441. The location of these values in the range depends on the specific variable being evaluated, which is assigned to one of seven automatic variables. Each of these seven variables has a designated ranking range, from "low" to "super high," this ranking is determined by the numerical value obtained for each variable.
Tests were performed with three different algorithms:
1. PCA (Principal Component Analysis):
- It is used to reduce the dimensionality of a data set with numerical variables.
- It is used to find the linear combinations of original variables that explain most of the variance of the data, 12.
- It is suitable when it is desired to eliminate multicollinearity between variables or to reduce the complexity of the data.
2. KPCA (Kernelized Principal Component Analysis):
- It is used when the data have a nonlinear structure and cannot be effectively separated by a linear transformation,12.
- It helps find nonlinear representations of the data.
- Suitable for nonlinear classification and pattern recognition problems.
3. IPCA (Incremental Principal Component Analysis):
- Used when performing principal component analysis on extensive data sets that do not fit in memory,13.
- It is helpful in the process and reduces the dimensionality of large volumes of data efficiently.
- It is suitable when working with massive or real-time data sets.

Figure 5. This figure shows the manual variables to obtain the best prediction algorithm.
Data obtained manually by digitization or records made by farmers are values obtained by visual evaluation. These values are classified in different ranges according to their specific variable. There are 9 variables in total, and each of them is assigned a range from "low," "medium," "high," and "medium-high" to "super high."
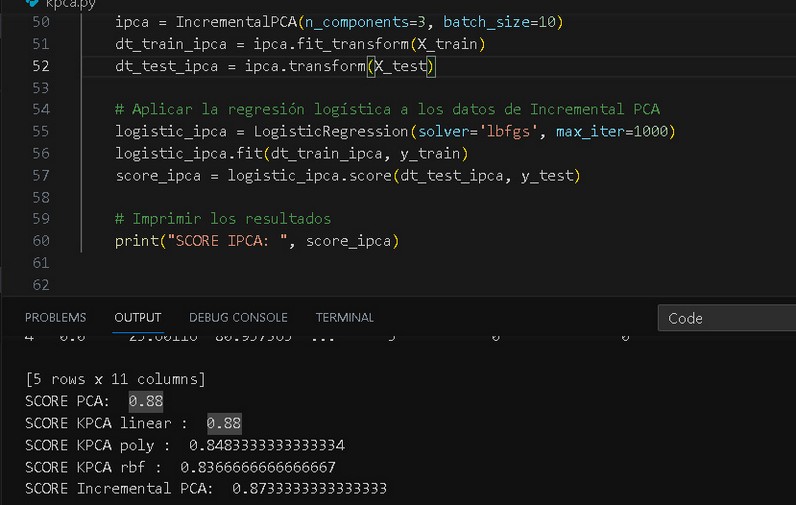
Figure 6. This figure represents the execution of the predictive models.
After applying logistic regression to the data transformed by PCA and IPCA, the following accuracy scores were obtained:
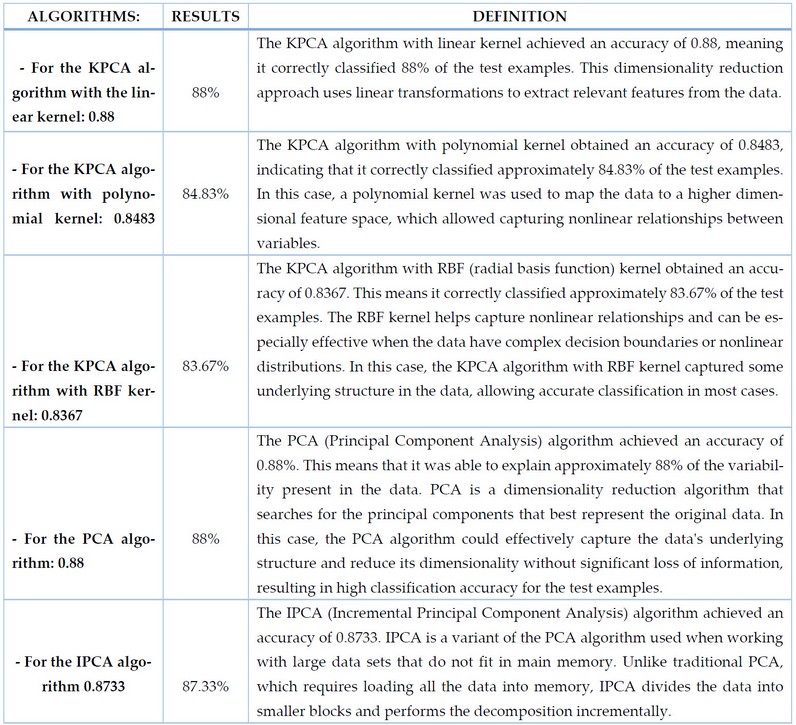
Table 1. This table contains a detailed comparison of the predictive models.
These results indicate that the PCA and IPCA algorithms demonstrated similar and superior performance to the various KPCA algorithms. However, the highest score was obtained using the PCA algorithm, with an accuracy score of 0.88. This suggests that PCA effectively captured the relevant information in the reduced data, which was reflected in a better predictive ability of the logistic regression model.
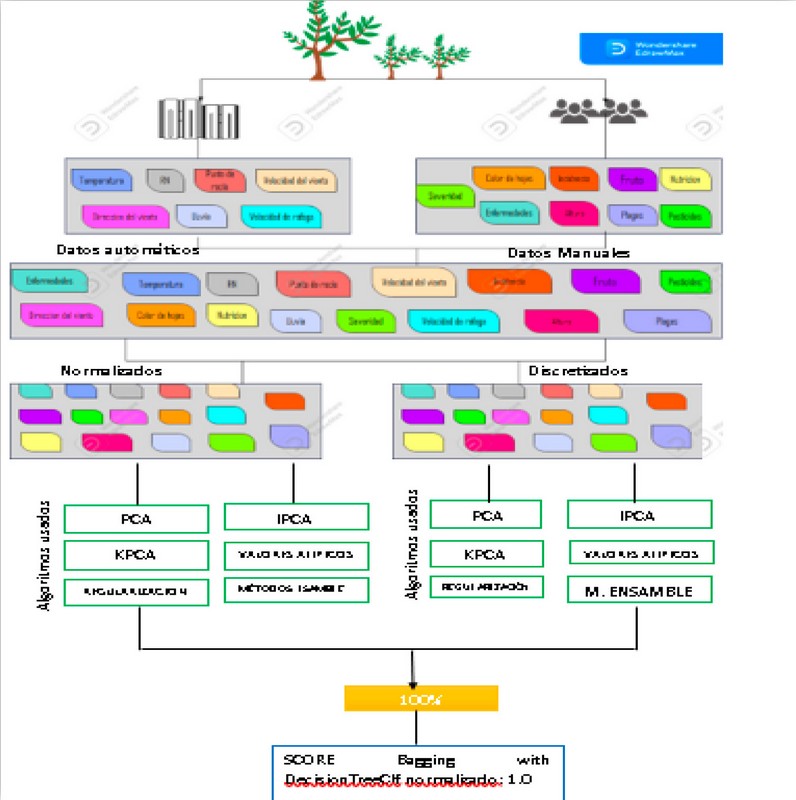
Figure 7. This figure is an Analysis of the algorithm.
In conclusion, from the results obtained, it is determined that the PCA algorithm is the most suitable for dimensionality reduction in this study. Its ability to preserve relevant information and its superior performance compared to the KPCA algorithms indicate that it is a valuable tool in analyzing and classifying the data used.
Statistical analysis
The logistic regression method was used as a classification and predictive analysis technique to evaluate the effectiveness of dimensionality reduction algorithms. The logistic regression implementation available in Scikit-learn was employed, with the 'lbfgs' solver and a maximum number of iterations of 1000.
The performance of the models was evaluated using the accuracy score as the evaluation measure. This score reflects the proportion of correct predictions made by the model.
Technologies used
REACT
React is a widely used JavaScript library for creating progressive web applications (PWA). Using React, you can make interactive and responsive user interfaces for your PWA applications. ,14.
Using React to create PWAs
Reusable components - React is based on the concept of components, allowing you to create reusable components that encapsulate the logic and UI of a specific application part. These components can be used in different application parts, facilitating a PWA's beginning and maintenance.
Virtual DOM: React uses a virtual DOM to perform efficient UI updates. Instead of directly manipulating the DOM, react compares the virtual DOM with the real DOM and applies only the necessary changes, which improves application performance.
Routing: React offers routers such as React Router that allow you to handle navigation and routing within a PWA. This is especially useful for creating dynamic routes and providing a smooth user experience.
Application state - React provides an easy way to manage the application state through its local state feature or state management libraries such as Redux. This allows for maintaining a consistent state in the application and makes it easy to manage data and changes in real-time.
PWA support: React supports a PWA's requirements, such as using Service Workers for caching and offline availability and the ability to install on the user's device. In addition, React-specific libraries and tools, such as Create React App, facilitate the initial setup of a PWA.
Connecting the PWA to MongoDB
Real-time queries and instant updates cement the link between PWAs and MongoDB. The interaction enables Progressive Web Applications to provide users instant updates, elevating their experience and interactivity.
Setting up MongoDB: first, we need a backend server that provides us with an API to interact with MongoDB. For this, we use the Python programming language and a framework.
Connecting to MongoDB from the backend server: We use a driver or client appropriate to the programming language we are employing. Each programming language has its own official MongoDB driver; for Node.js, we use the "Mongodb," which you can install through npm. To define the paths and drivers needed to manipulate the data in MongoDB.
This allows us to perform CRUD (create, read, update, delete) operations on the MongoDB database, such as making a new document, getting existing documents, revising documents, etc.
Integration of the PWA with the backend server: We use the Fetch API or an HTTP request management library to make requests from the PWA to the backend server. To create it secure. ,15.
Processing the responses from the backend server: When we receive the responses from the backend server in the PWA, we can process and display the data in our user interface as needed.
RESULTS
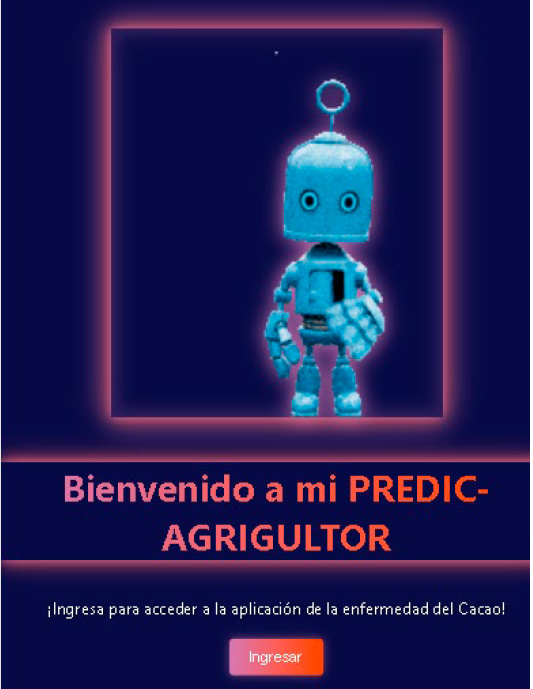
Figure 8. This figure represents the PWA design.
The monitoring and forecasting application results have exceeded our expectations, demonstrating its effectiveness in early and accurate detection of cocoa crop health. Integrating manual data provided by farmers and data collected by sensors has supplied a complete and precise picture of crop health in real-time.
Through detailed data analysis using machine learning algorithms, such as principal component analysis (PCA) and kernel PCA (KPCA), we identified key patterns and relationships between environmental variables and cocoa quality. These results are essential for developing effective predictive models that can accurately determine whether a crop is healthy or infected with Moniliasis. The application has proven to be a valuable tool for farmers and educational institutions. Farmers can use the application to constantly monitor their crops and obtain timely and accurate information on the health and performance of their plantings.
The ability to enter manual data, such as specific yield observations and environmental conditions, further enriches the forecasting models and allows for fine-tuning each planting.
Early and accurate detection of moniliasis is essential to avoid significant economic losses due to the spread of the disease. By receiving timely warnings of possible infections, growers can take targeted preventive and treatment measures in time. This reduces crop damage and maintains the quality of the cocoa beans, ensuring a high-quality end product.
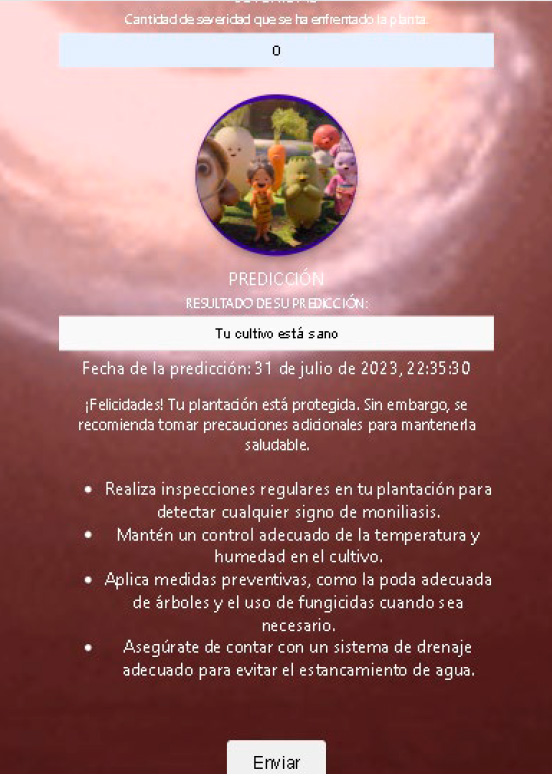
Figure 9. This figure represents the result when the crop is healthy.
After all, good results were achieved by monitoring the application and predicting a positive impact on the cocoa industry. Farmers can gain higher productivity and competitiveness, increase yields, and deliver high-quality products that meet consumer expectations. In addition, the application contributes to strengthening the industry's sustainability by ensuring more efficient farming methods and reducing resource wastage.
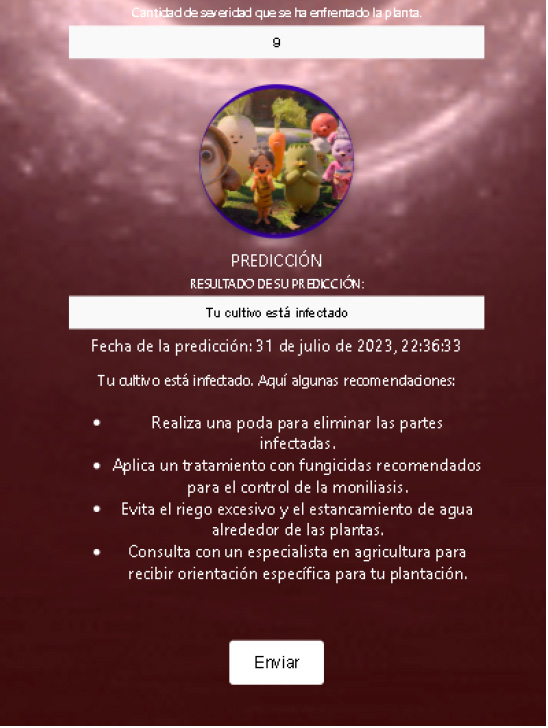
Figure 10. This figure represents the result when the culture is infected.
DISCUSSION
Developing a cocoa crop monitoring and forecasting system represents a significant stride forward in both agricultural and educational sectors. Below, we present the primary outcomes and conclusions derived from this project.
To begin with, the real-time monitoring system has empowered farmers with access to precise and up-to-the-minute information regarding the condition of their crops. The sensors have meticulously measured pivotal environmental variables influencing cocoa growth, encompassing humidity, temperature, and wind speed. Augmenting these data with manual observations contributed by farmers has notably increased the predictive model. This synergy has facilitated the early and precise identification of moniliasis, a fungal ailment adversely impacting cocoa fruit. Consequently, farmers can shield their crops, preventing substantial losses and upholding the caliber of harvested cocoa by promptly implementing specific treatments and preventive measures.
The Progressive Web App (PWA) integration has conferred an intuitive and readily accessible experience upon users, mainly offering tangible benefits to farmers. Through the app, farmers can instantaneously scrutinize the state of their crops in real-time, both on their mobile devices and web platforms. The app's user-friendliness has emerged as a pivotal factor that has fostered its widespread adoption.
Nonetheless, it is imperative to acknowledge that the absence of robust antecedents within the research somewhat constrains the discussion. For a more comprehensive and substantiated debate, it would be advantageous to draw comparisons and contrasts between the findings of this study and those of prior research endeavors related to cocoa crop monitoring and disease detection. Such an approach would proffer a more precise context and facilitate a more adept assessment of this study's contribution and relevance to the field.
CONCLUSIONS
In conclusion, this study represents a significant achievement in the quest for innovative solutions to the challenges facing cocoa cultivation, particularly in critical regions of Latin America and Africa, where this crop plays a pivotal role in sustaining rural communities. Our research title, 'Fighting Moniliasis in Orellana with Sensors and PWA for Sustainable Agriculture,' encapsulates our endeavor and reflects the essence of our work.
We have conclusively demonstrated that integrating cutting-edge technologies, such as sensors, MongoDB database management, Progressive Web Apps (PWAs), and predictive models, is an effective strategy for addressing the menace of moniliasis. This fungal disease threatens cocoa production and quality and has encountered a formidable adversary in our monitoring and forecasting system.
Our approach has significantly enhanced moniliasis's early detection and management, resulting in a direct upsurge in cocoa production and quality. This achievement not only holds positive economic implications but also wields a transformative impact on the lives of rural communities reliant on cocoa cultivation.
The utilization of machine learning algorithms, notably Principal Component Analysis (PCA) and Kernel PCA (KPCA), has enabled us to dissect complex data and extract critical insights that bolster the efficacy of our forecasting system.
Furthermore, we have democratized access to this technology by creating a user-friendly interface as a Progressive Web App (PWA). This ensures that farmers and educational institutions can harness this invaluable tool, fostering informed decision-making and optimizing agricultural practices.
REFERENCES
1. Correa Álvarez, J., Castro Martínez, S., & Coy, J. (June 6, 2014). Status of cocoa moniliasis caused by Moniliophthora roreri in Colombia. SciELO, 63(4). doi:http://dx.doi.org/10.15446/acag.v63n4.42747
2. Mamani, M., Villalobos, M., & Herrera, R. (2017). Low-cost web system to monitor and control an agricultural greenhouse. SciELO, 25(4), 599-618. Retrieved from https://scielo.conicyt.cl/pdf/ingeniare/v25n4/0718-3305-ingeniare-25-04-00599.pdf
3. Edem Kongor, J., Hinneh, M., Van de Walle , D., Ohene Afoakwa, E., Boeckx, P., & Dewettinck, K. (April 2016). Factors influencing quality variation in cocoa (Theobroma cacao) bean flavour profile - A review. sciencedirect, 82, 44-52. doi:https://doi.org/10.1016/j.foodres.2016.01.012
4. Quintero R., M. L., & Díaz Morales, K. M. (January 2004). The world cocoa market. 9(18). Obtenido de http://ve.scielo.org/scielo.php?script=sci_arttext&pid=S1316-03542004000100004
5. Munirah Mohd, Y., Nur Fazliyana, R., Muhaini, O., R, M., Rozlini, M., & Mohd Hafizul Afifi, A. (June 19, 2018). M-DCocoa: M-Agriculture Expert System for Diagnosing Cocoa Plant Diseases. webofscience, 700, 363-371. doi:10.1007/978-3-3-319-72550-5_35.
6. Cubillos, G. (June 2017). Frosty Pod Rot, disease that affects the cocoa (Theobroma cacao) crops in Colombia. sciencedirect, 96, 77-82. doi:https://doi.org/10.1016/j.cropro.2017.01.011
7. Challenger-Pérez, I., Díaz-Ricardo, Y., & Becerra-García, A. R. (April-June 2014). The Python programming language. redalyc, XX(2), 1-13. Retrieved from https://www.redalyc.org/pdf/1815/181531232001.pdf
8. Llamuca-Quinaloa, J., Vera-Vincent, Y., & Tapia-Cerda, V. (May 2021). Comparative analysis to measure performance efficiency between a traditional web application and a progressive web application. SciELO, 24(51). doi:https://doi.org/10.22430/22565337.1892.
9. MongoDB. (June 16, 2023). MongoDB. Retrieved from MongoDB: https://www.mongodb.com/es/products/compass
10. Kovalska, E., Baldicheva, A., & Somov, A. (May 23, 2020). Wireless Graphene Temperature Sensor. webofscience. Retrieved from https://www.webofscience.com/wos/woscc/full-record/WOS:000646236300011
11.Oyola-Garcia, A. E. (2021). The variable. Retrieved from http://www.scielo.org.pe/scielo.php?script=sci_arttext&pid=S2227-47312021000100016
12. Marukatat, S. (2023). Tutorial on PCA and approximate PCA and approximate kernel PCA. REVIEW OF ARTIFICIAL INTELLIGENCE, 56, 5445-5477. doi:10.1007/s10462-022-10297-z. doi:10.1007/s10462-022-10297-z
13. Daga, y., & Nachar, R. (2006). Face recognition using IPCA-ICA algorithm. IEEE TRANSACTIONS ON PATTERN ANALYSIS AND ARTIFICIAL INTELLIGENCE, 28, 996-1000. doi:DOI10.1109/TPAMI.2006.118.
14. Boersma, S., & Lungu, M. (2021). React-bratus: Visualizing React Component Hierarchies. 2021 WORKING CONFERENCE ON SOFTWARE VISUALIZATION (VISSOFT 2021), 130-134. doi:10.1109/VISSOFT52517.2021.00025.
15. Sysel, M., & Dolezal, O. (2014). An Educational HTTP Proxy Server. MODERN TRENDS AND TECHNIQUES IN COMPUTATION SCIENCE (CSOC 2014), 285, 541-547. doi:10.1007/978-3-3-319-06740-7_46.
Received: 9 October 2023/ Accepted: 15 January 2024 / Published:15 February 2024
Citation. Urquizo J, Jiménez M, Aguilar P, Chango W. Fighting moniliasis in Orellana with sensors and PWA for sustainable agriculture. Revis Bionatura 2024; 1 (1) 5. http://dx.doi.org/10.21931/RB/2024.01.01.5
Additional information Correspondence should be addressed to jessica.urquizo@espoch.edu.ec
Peer review information. Bionatura thanks anonymous reviewer(s) for their contribution to the peer review of this work using https://reviewerlocator.webofscience.com/
All articles published by Bionatura Journal are made freely and permanently accessible online immediately upon publication, without subscription charges or registration barriers.
Publisher's Note: Bionatura stays neutral concerning jurisdictional claims in published maps and institutional affiliations.
Copyright: © 2023 by the authors. They were submitted for possible open-access publication under the terms and conditions of the Creative Commons Attribution (CC BY) license (https://creativecommons.org/licenses/by/4.0/).