
Predictive Model in Production through Progressive Web Applications to Forecast Moniliasis in Cacao.

Aracely Miranda1*, Byron Bonifaz2, Wilson Chango3, Pedro Aguilar4.
1 Escuela Superior Politécnica de Chimborazo Orellana Campus, Coca, Ecuador.
2 Escuela Superior Politécnica de Chimborazo Orellana Campus, Coca, Ecuador.
3 Escuela Superior Politécnica de Chimborazo Orellana Campus, Coca, Ecuador.
4 Escuela Superior Politécnica de Chimborazo Orellana Campus, Coca, Ecuador.
* Correspondence: aracely.miranda@espoch.edu.ec ; Tel.: 0987941316; country code: 593;
Available from. http://dx.doi.org/10.21931/BJ/2024.01.01.14
ABSTRACT
Cocoa is considered a significant crop in Ecuador, as it represents a favorable source of income for the country's economy, thanks to the remarkable quality of the product. However, it faces a significant issue in its crops: moniliasis, a fungal disease that attacks cocoa cultivation, is present in most Latin American countries. Consequently, this leads to decreased cocoa production and a lower final product quality. The study focuses on designing a predictive production model through a progressive web application to forecast moniliasis in cocoa. The objective is to create an application that anticipates the presence of this disease, thereby contributing to the improvement of the local economy for all farmers. Various methodologies were employed, including bibliographic methods, design science research methodology, and machine learning models. The results obtained from this research indicate that the Gradient Boosting Classifier is the algorithm that best fits the provided dataset. Once this algorithm was identified, a progressive web application was developed and made available for public use by farmers. Furthermore, the efficiency of the predictive model was verified using the statistical method of central tendency, demonstrating that the predictive model is beneficial, primarily by saving farmers a significant amount of time. Anticipating the disease enables timely preventive and corrective measures, which could reduce losses in cocoa production and enhance the quality of the final product.
Keywords: cacao, moniliasis, predictive model, progressive web apps, supervised learning.
INTRODUCTION
Ecuador is historically known as one of the leading producers of aromatic and delicious cocoa in the world, where the quality of the fruit depends on various aspects, such as proper ripeness, absence of insect infestation, diseases, and mechanical damage, among others. However, in recent years, cocoa seed imports have decreased mainly due to some diseases, with the most relevant being "Black Pod Rot," "Witch's Broom," and "Moniliasis," the latter being the most common disease in cocoa plantations. Therefore, there is a current desire to find a solution or method to prevent this disease from continuing to affect cocoa fruits and thereby mitigate damage to the plantations and benefit the farmers' economy6 8.
This solution involves the development of a predictive model in cocoa production through a progressive web application aiming to predict moniliasis in the crop. We have come across research, such as that by Koysawat et al.10, which emphasizes the importance of data collection in agriculture to obtain relevant information supporting decision-making. For this reason, they propose developing a progressive web application that replaces the traditional manual note-taking process, aiming to reduce errors in data recording and collection. This study was conducted to significantly reduce the time required to gather sugarcane sampling data, reducing 45.28%.
Additionally, Ordoñez J.15 points out that programming can be a powerful tool for generating algorithms from data, allowing for an approximation of the process that leads to conclusive results. This is what we know as Machine Learning, which involves creating a data model based on specific inputs and optimizing its parameters through programming. These optimized parameters are used to predict future outcomes. Machine Learning employs statistical theory principles to develop models, relying on inference from data samples. Furthermore, it utilizes computational programming and efficient algorithms to enhance and apply the model to predictions. This study demonstrated that this technology can be effectively used to predict total production, specifically in the case of cow lactation in the Northern Sierra of Ecuador.
Everything mentioned above significantly contributed to the development of this research, providing a clear understanding of concepts related to Progressive Web Applications, data collection, the use of Machine Learning, and predictive models. These technologies were combined to create a predictive model through a Progressive Web Application for forecasting moniliasis in cocoa. As a result, a novel and beneficial application for the agricultural sector has been developed, one that has not been seen before.
This research was conducted in the Canton of Joya de los Sachas because this location provided the relevant and necessary data obtained through a sensor in said Canton. Additionally, farmers provided some essential data manually regarding cocoa fruits, which helped make this prediction more accurate. Using machine learning techniques and developing a progressive web application will enable timely decision-making and contribute to developing a more efficient agricultural strategy to address moniliasis in cocoa.
The research problem is focused on the presence of moniliasis in cocoa crops, which negatively affects production and product quality, impacting the local economy and the livelihood of farmers.
That is why, in the present research, the following questions are posed, which are addressed throughout the development of this study:
1. Which algorithm among those developed provides the best predictive result?
2. Does the predictive model in production assist users in making timely decisions regarding the forecast of moniliasis?
This research aims to design a predictive model for cocoa production that allows forecasting moniliasis through a progressive web application, providing farmers with a tool to make timely decisions to address the disease and improve the local economy.
For the development of the predictive model in cocoa production, an expository bibliographic analysis was carried out to select and analyze relevant information about using predictive models for moniliasis in cocoa and the development of progressive web applications2. Supervised learning was used as the approach for machine learning, allowing for precise extraction of information about the expected outcome. Comparison and analysis tests of available algorithms were performed using Python and the Scikit-Learn library12 17. The NoSQL database management system, specifically MongoDB, was chosen due to its flexibility for data with significantly different structures. A progressive web application using JavaScript and React was also developed to offer an efficient and fast user experience14 5.
The developed predictive model is expected to enable early detection of moniliasis in cocoa crops, allowing farmers to make timely decisions to address the disease and reduce damage to production and product quality. The progressive web application will provide a user-friendly tool for farmers, enhancing their capacity to address moniliasis and benefit the local economy7.
The article is structured into different sections. It begins with an introduction that briefly places the study in a broad context and highlights its importance. Next, it defines the purpose of the work and its significance. The research problem is then presented, identifying the diseases affecting cocoa cultivation in Ecuador and the importance of addressing moniliasis. The methodology includes the expository bibliographic analysis and the selected machine learning approach. The tools and technologies used, such as Python, Scikit-Learn, MongoDB, and the progressive web application developed with JavaScript and React, are detailed17 10. Finally, the article's general structure is presented, including describing the materials and methods used, the results obtained, the discussion, and the study's conclusions.
MATERIALS AND METHODS
The study was based on a design science research methodology focused on creating a predictive model for cocoa production through a progressive web application to forecast moniliasis in the crop. Three cycles were carried out within the framework of the design science research methodology: the relevance cycle, rigor cycle, and design cycle. These cycles were centered on research and the search for helpful information to create an artifact within a specific context16.
The variables considered in this study are related to aspects of cocoa cultivation and the presence of moniliasis. Various attributes of the crop were measured, such as proper ripeness, the presence of insect infestation, the occurrence of diseases, and mechanical damage, among others. This data was used to train the predictive model and forecast the probability of moniliasis in the crops3.
The study procedure included conducting an expository bibliographic analysis to select and analyze relevant information about using predictive models for moniliasis in cocoa and developing progressive web applications. Supervised learning was used as the approach for machine learning, allowing for precise information extraction about the expected outcome9. Comparison and analysis tests of available algorithms were performed using Python and the Scikit-Learn library. A progressive web application using JavaScript and React was developed to provide an efficient and fast user experience16.
Data analysis was performed using machine learning techniques and artificial intelligence models. Supervised learning algorithms, such as Support Vector Machines, Logistic Regression, Decision Trees, Linear Regression, Non-linear Regression, and Neural Networks, were applied to evaluate which one provided the best predictive result. Python and the Scikit-Learn library were used to implement and validate the predictive models18 11.
Ethical considerations were considered in the study regarding the handling and privacy of the collected data. Confidentiality of the information provided by the farmers was ensured, and proper consent was obtained for the use of the data in the research.
The study may have faced limitations, such as the availability of complete and representative data to train the predictive models. Additionally, the model's performance could be affected by the quality of the data used and the variability of conditions in cocoa plantations.
To ensure the reproducibility of the results, widely used open-source tools and libraries, such as Python and Scikit-Learn, were employed. The procedure and methodology details were described clearly and concisely to enable other researchers to replicate the study and validate the findings.
RESULTS
Expository Bibliographic Analysis
In this bibliographic analysis, the search was conducted through physical and electronic books available on the Internet to design the predictive model to avoid any complexity. Additionally, it aimed to assist in developing the progressive web application and make it user-friendly, specifically for farmers, ensuring ease of use. After completing this review, it is possible to achieve an optimal level of learning to begin designing the predictive model and the web application.
Comparison of Algorithms
To obtain a predictive model that allows forecasting moniliasis in cocoa fruits with the highest level of reliability, a comparison of different types of Machine Learning algorithms was performed. Essentially, these algorithms help reduce the complexity of possible issues that could arise in this predictive model by implementing specific models detailed in this report. The implemented methods include Dimensionality Reduction Techniques, Regularization trends, handling outliers with robust regressions, and ensemble methods. Furthermore, these algorithms were trained and compared using a data set to verify their correct or more accurate performance. For this reason, before implementing the algorithms, a general data set was created by combining the data obtained from the sensors and manually collected data reports from cocoa plants. Subsequently, data treatment was applied to create the data set with the .csv extension, as shown in Figure 1. The dataset created and used for the experiments has been uploaded to the Figshare repository. It can be found through the following private link https://figshare.com/s/4fb8bfd0ccbee4f4bcca or through the DOI provided when published in that repository 10.6084/m9.figshare.24112803.

Figure 1. Created dataset file with .csv extension
So, it was concluded that the techniques to be applied for the proper functioning of the model and to avoid falling into problems of complexity or simplicity are as follows:
Dimensionality Reduction Techniques
From the conducted data set, it is necessary to determine or identify which features affect the Machine Learning models or algorithms. It is not recommended to have too many features because variables might become irrelevant, leading to increased computational costs. There is also a risk of missing values, which can introduce significant biases and compromise the predictive capacity. To address this, dimensionality reduction techniques were applied using the following algorithms: PCA, IPCA, and KPCA. The latter has three standard kernels: linear, polynomial, and Gaussian. Part of the code is shown in Table 1:

Table 1. Algorithms PCA, IPCA, and KPCA
If you wish to observe the developed algorithms in detail, you can access the following link: https://github.com/Abel272000/skict-01. This link leads to a repository created on GitHub. The results obtained with the three algorithms were as follows. They were implemented or conducted with normal, normalized, and discretized data. Surprisingly, the same results were obtained for each of them. These results are shown in Table 2:

Table 2. Results with standard data, normalized data, and discretized data.
Based on all the tests conducted and the data analyzed through the presented table, it can be concluded that:
We work with average, normalized, and discretized data to yield better PCA, IPCA, and KPCA Linear results. Therefore, these three algorithms can be chosen and used for training a predictive model.
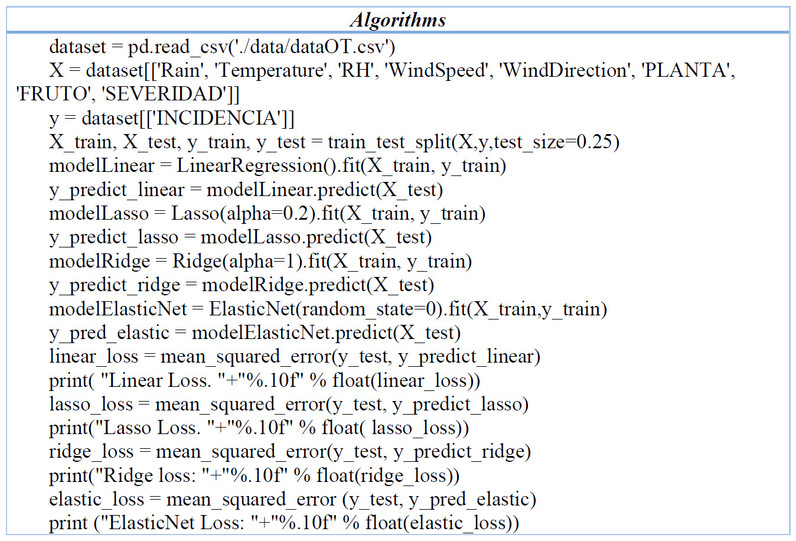
Table 3. Algorithms the regularization
Regularization Trend
Continuing with the methods to avoid complexity and simplicity issues, we have a regularization trend, which involves penalizing features that do not contribute or subtract relevant information to the predictive model. We find Linear, Lasso, Ridge, and ElasticNet in this technique. These are shown in Table 3.
The chosen results in this case are from the discretized data, as they yielded lower errors, as shown in Table 4:

Table 4. Results with discretized data.

Table 5. Algorithms Outliers with Robust Regressions
This leads us to conclude that the regularization technique provides more favorable results when working with ElasticNet score, whether with average, normalized, or discretized data. This algorithm will yield results with the lowest possible errors. Examining which variable carries the most weight appears to be related to rainfall, temperature, and severity.
Outliers with Robust Regressions
We must consider outliers, as they may be present in our data set, which can introduce significant biases in our models. Robust regressions can help identify these outliers. In this context, Sci-kit learn provides RANSAC and Huber Regressor to address the presence of outliers in our data set. The model is presented in Table 5.
In this model, tests were conducted with average, normalized, and discretized data, and the results in all three cases were the same, as shown in Table 6 in general form:

Table 6. Results with normal data, normalized data, and discretized data.
Among the robust regression models, the SVR model performs better, where a lower value is considered better, with a score of 0.169.
Ensemble Methods
Next, ensemble methods, which combine different methods with various configurations and apply a consensus approach, are employed. There are two strategies:
Bagging Strategy
In this strategy, the variance of individual classifiers is reduced by combining them Table 7 illustrates the strategy:

Table 7. Algorithms Bagging
Working with normalized data was chosen in this strategy because it yields higher results than normal or discretized data. The results obtained are detailed in Table 8:

Table 8. Results with normalized data.
This result shows that more favorable results are obtained with the Bagging strategy when working with normalized data. RandomTreeForest consistently produces the best or highest results in all three cases.
Boosting Strategy
The other strategy is Boosting, a sequential method that gradually strengthens a learning model using the residual error from previous stages. The final result is also achieved through consensus among all the models. This strategy is presented in Table 9:

Table 9. Algorithms Gradient Boosting Classifier
The best results were obtained with all three types of data, as shown in Table 10:

Table 10. General Results
Based on these findings, it can be concluded that when working with Boosting using the Gradient Boosting Classifier algorithm, whether with average, normalized, or discretized data, the same results are obtained. However, compared to the previous models, Boosting presents the best possible result in this analysis.
Global analysis of all results obtained

Figure 2. General analysis
According to the numbering in the previous graph:
1. To create this predictive model, data was needed from a sensor and data provided by farmers, which are represented in the purple-colored boxes in the previous graph.
2. The information from each source is stored in Excel documents. The sensor data includes key variables such as rainfall, temperature, and humidity. The information provided by farmers includes plant number, number of fruits, severity, and incidence, as shown in the yellow-colored box.
3. After gathering this data, it undergoes a process or treatment to create the final data set, represented by the orange-colored box.
4. Once the data is obtained, it is normalized, and each algorithm within each group (shown in the top-left box) is applied. The group includes algorithms for Trend regularization (Linear, Lasso, Ridge, and ElasticNet) and Outliers with Robust Regressions (RANSAC and Huber Regressor). In this case, the algorithm with the lowest result is SVR with a value of 0.1699. The bottom box includes techniques for Dimensionality Reduction (PCA, IPCA, and KPCA: linear, polynomial, and Gaussian) and Ensemble Methods (Bagging and Boosting), where the Gradient Boosting Classifier algorithm yields the best result with 0.99.
5. When discretizing the data, the same algorithms are applied in the groups for Trend regularization and Outliers with Robust Regressions, and the SVR algorithm still provides the lowest result with a value of 0.1699. In the bottom box, the Dimensionality Reduction and Ensemble Methods techniques still show that the Gradient Boosting Classifier algorithm yields the best result with 0.99.
6. The conclusion is reached that both normalized and discretized data can be used as they yield high results with the Gradient Boosting Classifier algorithm, obtaining 0.99.
7. Additionally, the implementation of the algorithm is analyzed with two parameter optimization techniques, Randomized Search CV and Grid Search CV, with the latter providing the highest result.
8. Finally, the trained predictive model is obtained after completing the entire process presented in this graph and can make accurate predictions.
Development of the Artifact
The development of the artifact follows the methodology of design science, which comprises three cycles: relevance cycle, rigor cycle, and design cycle13.
a). Relevance Cycle
In the first cycle, a comprehensive investigation was conducted concerning moniliasis disease and the context of cocoa, which is considered a crucial crop in Ecuador. Cocoa represents a significant source of income for the country's economy due to its high-quality products. However, the presence of moniliasis, a fungal disease affecting cocoa crops, threatens the product's quality. Therefore, strategies were sought to manage and prevent this disease, aiming to propose possible alternatives for the predictive model. Additionally, it was crucial to analyze the real impact of this disease on cocoa crops to identify the farmers' urgent needs and how beneficial a predictive model would be for them.
b). Rigor Cycle
The previous analysis provided a better understanding of the requirements and needs for controlling or preventing the disease. The main goal here is to detect when the disease affects the product. This led to developing the predictive model and the subsequent creation and design of the progressive web application (PWA). The research involved investigating how to build the predictive model, which technologies to use, the utilization of sensors, data acquisition, system architecture, and more. All the findings from the literature review were incorporated into this phase.
c). Design Cycle
This study focuses on designing a predictive model in production by developing a progressive web application to forecast moniliasis in cocoa. The aim is to create an application that can predict the presence of this disease before it contaminates other plantations. With all the gathered information, the structure shown in Figure 3 was established to provide a clear roadmap for the project's design process.

Figure 3. Architecture
Development
While developing the Progressive Web App (PWA), React, a JavaScript library, created the Frontend component. This library was chosen due to its capability to enable offline functionality, a characteristic that identifies a PWA. On the other hand, the Python programming language was selected for the Back-end component, utilizing the Flask framework. A simplified structure was designed, concentrating the business logic in a file called "app.py." This architectural decision was made to facilitate interaction and resource consumption by the Frontend component of the PWA. The predictive model is implemented within the back end, a fundamental element for the application's operation, as it can make real-time predictions. Its components and files can be seen in Figure 4. To enable offline mode for the PWA, a "getdata" function sends a request to a predefined route in the back end, retrieving data from the database. This data is then stored in the browser's local storage for offline functionality.

Figure 4. Back-end and frontend files
This predictive model represents a key component in the interface between the front end and back-end of the PWA, significantly contributing to achieving the research objectives. The PWA's interface can be observed in Figure 5, where data obtained from the sensor is extracted from the MongoDB database.

Figure 5. Data obtained from the sensor extracted from the database created in MongoDB
Next is the section where the farmer inputs manual data and clicks the "predict" button at the bottom. With this data entered by the farmer, it is sent to the back-end, which processes this data along with the latest data extracted from the database and sends it to the predictive model. The predictive model analyzes the data and provides a prediction of whether the fruit is contaminated or not, as seen in Figure 6, with the result obtained, the farmer will have the opportunity to make timely decisions regarding whether their fruit has moniliasis, where they can apply control protocols or take precautions to prevent the contamination of their other fruits.

Figure 6. Data entered by the farmer and prediction made with all the data entered
Furthermore, the developed PWA has a section called "History," where all predictions made are stored, as seen in Figure 7.

Figure 7. History of all predictions made
Data Analysis
Data analysis was performed to assess the efficiency of the predictive model using the statistical method of central tendency4. Two groups were established for data collection: a control group and an experimental group, from which quantitative data would be obtained. The authors of this research formed the experimental group, while the farmers in the Joya de los Sachas region constituted the control group. The data collection focused on assessing time efficiency, aiming to identify how long it takes for farmers to recognize the moniliasis disease in cocoa plantations and how long it would take them to identify the disease using the developed predictive model. To gather this information, interviews were conducted with some farmers to determine the time they take to identify the disease.
Additionally, a survey was conducted to collect data that would help the experimental group identify the time it takes to detect whether a fruit is infected. Around 25 farmers were interviewed, and 5 of them responded. The other farmers could not answer as they lacked the necessary tools to provide the required data for predicting in the predictive model.
The data obtained from the 5 farmers are presented in Table 11.

Table 11. Data collection
With the data obtained, the control group (farmers) evaluates each fruit and records the time it takes to assess each one for infection, as presented in Table 12.

Table 12. Data collected from the control group
Similarly, the experimental group records the time it took them to identify whether a fruit is infected or not using the PWA, shown in Table 13.

Table 13. Data collected from the experimental group
Upon comparing the data from these two groups and applying the mean as one of the measures of central tendency, the following results were obtained in Table 14 and Figure 8:

Table 14. Comparison of results obtained from both groups

Figure 8. Comparison of the results obtained in verifying the efficiency regarding time
After the completion of data collection and processing, a stark difference was evident between the two groups. The control group took an average of 28.6 minutes per fruit to identify whether it was infected. In contrast, using the PWA with the implemented predictive model, the experimental group took an average of 0.29 minutes per fruit.
Threats to the Validity of the Study
External variables may affect or not provide validity to this study, for example, the lack of availability of complete data or new requirements needed to improve prediction. It can also happen that the pathogen causing moniliasis disease mutates or evolves with some antibodies or something similar, which can alter the prediction of this model. On the other hand, as it is known that every predictive model has a beginning and an end, the end may come when you want to update this model, that is, add relevant external features or factors such as the type of soil where cocoa plants are grown, or the type of climate, plant height, etc.
DISCUSSION
The discussion provides valuable insights into the various aspects of the study, such as the expository bibliographic analysis, comparison of different machine learning algorithms, the development of the artifact, data analysis, and the research presented by Koysawat et al.10 and Ordoñez J.15 greatly aided in the successful development of this research. Here are some key points from each section:
The study starts with a comprehensive literature review, which involves searching for relevant information through physical and electronic books available on the Internet. The objective was to design the predictive model and the progressive web application (PWA) in a user-friendly manner, specifically for farmers. This analysis aimed to achieve an optimal level of learning to begin designing the predictive model and the PWA.
The study compared different types of machine learning algorithms to build a reliable predictive model for forecasting moniliasis in cocoa fruits. These algorithms included Dimensionality Reduction Techniques (PCA, IPCA, and KPCA), Regularization Trends (Linear, Lasso, Ridge, Elastic Net), handling outliers with Robust Regressions (RANSAC, Huber Regressor), and Ensemble Methods (Bagging and Boosting).
The study conducted tests with different data sets (normal, normalized, and discretized data) to evaluate the performance of each algorithm. Results were recorded and analyzed for each algorithm, and conclusions were drawn based on the best-performing algorithms.
The development of the artifact (PWA) followed the methodology of design science, comprising three cycles: the relevance cycle, rigor cycle, and design cycle. In the relevance cycle, investigations were made concerning the moniliasis disease and cocoa cultivation. The rigor cycle involved understanding the requirements and needs for controlling or preventing the disease, leading to the development of the predictive model and PWA. The design cycle focused on designing the predictive model in production and creating the PWA.
This allowed for the integration of the PWA and the predictive model. With the data input and tests conducted, it was verified that the created Progressive Web Application functions perfectly, assisting in forecasting the disease more efficiently and quickly. This, in turn, helps farmers make early decisions regarding the salvation or treatment of fruits contaminated with this disease.
Data analysis was performed to assess the efficiency of the predictive model using the statistical method of central tendency. The study collected data from both a control group (farmers) and an experimental group (authors of the research) to evaluate the time efficiency of identifying moniliasis in cocoa fruits. The control group assessed each fruit manually, while the experimental group used the PWA with the predictive model to detect the disease.
The results showed a significant difference in time efficiency between the two groups. The experimental group using the PWA took an average of 0.29 minutes per fruit, while the control group took an average of 28.6 minutes per fruit. This highlights the effectiveness and potential time-saving benefits of using the predictive model and PWA for disease detection.
The study successfully achieved its objectives by designing a predictive model and a user-friendly progressive web application for forecasting moniliasis in cocoa cultivation. The comparison of different algorithms and the data analysis demonstrated the efficiency of the predictive model in significantly reducing the time required for disease detection.
CONCLUSIONS
The study's main objective was to develop a predictive model for cocoa production that would allow predicting the presence of moniliasis, a fungal disease that affects cocoa crops. To achieve this, a design science research methodology was used, and a Progressive Web Application (PWA) was implemented to facilitate farmers' access and use of the model. Specific objectives included conducting a bibliographic analysis to design the model, comparing different machine learning algorithms, performing data analysis using artificial intelligence techniques, and developing an efficient Progressive Web Application.
After conducting the data analysis and comparing different machine learning algorithms, the following key findings were obtained:
Dimensionality reduction algorithms (PCA, IPCA, and KPCA) and the Gradient Boosting Classifier algorithm showed the best predictive results. The SVR algorithm demonstrated the best performance in the Trend Regularization technique to reduce the complexity of the model. The Bagging technique with the Random Tree Forest algorithm yielded excellent results in the context of normalized data.
The Gradient Boosting Classifier is the algorithm developed and analyzed that provides the best predictive result and is placed in the predictive model.
Furthermore, a data analysis was performed, where the average time for the experimental group to identify the presence of moniliasis using the PWA with the predictive model was only 0.29 minutes per fruit, compared to the control group, which took an average of 28.6 minutes per fruit.
These findings indicate that the developed predictive model and the Progressive Web Application can effectively predict the presence of moniliasis in cocoa crops. Using machine learning algorithms and artificial intelligence techniques allowed for accurate and fast results, which can be highly useful for farmers in early disease detection and informed decision-making for control and prevention.
Furthermore, the study acknowledges some limitations, such as data's complete and representative availability to train the predictive models. Additionally, the model's performance may be affected by the quality of the data used and the variability of conditions in cocoa plantations. These limitations should be considered when interpreting the results and applying the model in practice.
The study's practical implications are significant, as the predictive model and Progressive Web Application can provide farmers with a valuable tool to improve the management and prevention of moniliasis in cocoa crops. It is recommended that the model be continuously improved and updated with new data to maintain its accuracy and effectiveness over time. Furthermore, exploring the integration of other variables and technologies is suggested to increase the predictive capability and user-friendliness of the tool.
The study successfully developed an effective predictive model to forecast the presence of moniliasis in cocoa crops and applied it through a Progressive Web Application. The results demonstrated the utility and potential of this tool in the agricultural context. The research reaffirms the importance of combining science and technology to address real problems and provide practical solutions to farmers. Hopefully, this initiative will contribute to improving the productivity and sustainability of cocoa crops and facing agricultural challenges with innovative and efficient approaches.
REFERENCES
1. de Andrade Cardieri G, Zaina LAM. PWA-EU: Extending PWA Approach for Promoting Customization based on User Preferences. Proc ACM Hum Comput Interact. 2019 Jun 13;3(EICS):1–28.
2. Andreina P, Ayala M. Bibliographic Research: Definition, Types, Techniques. 2018.
3. Arcentales Garcia. Estefania P. Variation in the potential distribution of cocoa cultivation in the coastal region of Ecuador by 2050, due to climate change. 2019.
4. Burgos-Martínez R, Argüelles-Pascual V, Palacios RH. Phases of the statistical method. Publicación semestral [Internet]. 2021; 9(17):35–6. Available from: https://repository.uaeh.edu.mx/revistas/index.php/huejutla/issue/archive
5. Castro Romero A, Sebastián González Sanabria J, Callejas Cuervo M. Utility and operation of databases NoSQL Databases NoSQL's Utility and Functioning. Vol. 21. 2012.
6. Correa Álvarez J, Castro Martínez S, Coy J. Biology stage of Moniliophthora roreri in Colombia. Acta Agron. 2014;4(63):388–99.
7. García-Briones AR, Pico-Pico BF, Jaimez RE. The Cocoa production chain in Ecuador: Resilience in the different production actors. NOVASINERGIA Digital Magazine of Science, Engineering and Technology. 2021 Dec 1;4(2):152–72.
8. James Quiroz V. Influence of agronomy and harvest on cocoa quality. 2012.
9. Judith Sandoval L. Machine learning algorithms for data analysis and prediction. ITCA-FEPADE. 2018;(11):36–40.
10. Koysawat P, Boonprakob C, Saengprachatanarug K, Chaosakul A, Wanjantuk P, Wongphati M, et al. Progressive Web App for Crop Field Data Collection. IOP Conf Ser Mater Sci Eng. 2021 Aug 1;1163(1):012018.
11. Majchrzak TA, Biørn-Hansen A, Grønli TM. Progressive Web Apps: the Definite Approach to Cross-Platform Development? [Internet]. Proceedings of the 51st Hawaii International Conference on System Sciences. 2018. 5735–5744 p. Available from: http://hdl.handle.net/10125/50607
12. Marcelino P, de Lurdes Antunes M, Fortunato E, Gomes MC. Machine learning for pavement friction prediction using scikit-learn. In: Lecture Notes in Computer Science (including subseries Lecture Notes in Artificial Intelligence and Lecture Notes in Bioinformatics). Springer Verlag; 2017. p. 331–42.
13. Norman Anuar N, Kamal Othman M. Integrating User-Centered Design with the Agile Software Development Methodology for a Cultural Heritage Information System. Interaction Design and Architecture(s) Journal - IxD&A. 2020;44:207–55.
14. de Oliveira DC, Barbosa UC, Bergland ACRO, Resende O, de Oliveira DEC. G-SOJA - website with prediction on soybean classification using machine learning. Engenharia Agricola. 2021;42(SpecialIssue).
15. Ordoñez Merino J. Predictive model applying machine learning algorithms for dairy production at the El Prado farm. 2023;
16. Robles S, Vásquez H, Naranjo L. Adapting Design Science Methodology in luminaires development. Revista de la Facultad de Ingenierías y Tecnologías de la Información y Comunicación. 2019;2(6).
17. Vadakkan AS, S SR, Khateeb A, Professor A. Cyberbullying Detection in Textual Modality. IJACSA) International Journal of Advanced Computer Science and Applications [Internet]. 2021;12(12):217–21. Available from: www.ijacsa.thesai.org
18. Zamorano Ruiz J. Comparison and analysis of machine learning algorithms for predicting the predominant type of tree cover. 2018.
Received: October 9th 2023/ Accepted: January 15th 2024 / Published:15 February 2024
Citation: Miranda A, Bonifa B, Chango W, Aguilar P. Predictive Model in Production through Progressive Web Applications to Forecast Moniliasis in Cacao. Bionatura journal 2024; 1 (1) 14. http://dx.doi.org/10.21931/BJ/2024.01.01.14
Additional information Correspondence should be addressed to aracely.miranda@espoch.edu.ec
Peer review information. Bionatura Journal thanks anonymous reviewer(s) for their contribution to the peer review of this work using https://reviewerlocator.webofscience.com/
All articles published by Bionatura Journal are made freely and permanently accessible online immediately upon publication, without subscription charges or registration barriers.
Publisher's Note: Bionatura Journal stays neutral concerning jurisdictional claims in published maps and institutional affiliations.
Copyright: © 2024 by the authors. They were submitted for possible open-access publication under the terms and conditions of the Creative Commons Attribution (CC BY) license (https://creativecommons.org/licenses/by/4.0/).