
Heart failure prognostic algorithm using Spectral Analysis and MATLAB software.

Siza Moposita Segundo Fabián 1, Sáez Paguay Miguel Ángel 2, Fiallos Godoy Yesenia Maricela3 Ricardo Fabián Siza Gualpa4,
1 Escuela Superior Politécnica de Chimborazo, Facultad de Ciencias. Orellana, Ecuador.
2 Escuela Superior Politécnica de Chimborazo, Facultad de Recursos Naturales. Orellana, Ecuador.
3 Hospital General Docente de Ambato. Ambato, Ecuador.
4 Escuela Superior Politécnica de Chimborazo, Facultad de Ciencias. Riobamba, Ecuador.
*Correspondence: fabian.siza@espoch.edu.ec; Tel.: +593 0984259193 SMSF
Available from. http://dx.doi.org/10.21931/BJ/2024.01.01.12
ABSTRACT
Fourier analysis for biological signals is based on the use of the infinite sum of sines and cosines that allows modelling: the periodic functioning of the heart, its amplitude, frequency, and phase period, transforming these signals into images called ECG, based on studies and programs that model the ideal functioning of the heart. In this work, a mathematical algorithm has been designed to predict the cardiac pathology called bradycardia, which relates the prolongation of the monthly QT interval in the order of 10-4 seconds/month in a time of 10 years with the ventricular alteration. MATLAB software and spectral analysis are used to contrast the spectrum without pathology, which contains harmonics of greater amplitude, with a spectrum already with pathology that reaches heart failure, where the most significant number of harmonics are grouped in the first values, and then the model with an exponential function the delay of the QT interval in the ECG, concluding that up to 40 months after the onset of the pathology, the patient can counteract the disease. In comparison, by 80 months, difficulties arise, even the disease becomes irreversible in the last months, and the blood-propelling organ ceases to function.
Keywords: Heart Failure Prognostic, Bradycardia, Fourier Series, Spectral Analysis.
INTRODUCTION
The increase in life expectancy brings more significant exposure to risk factors, which leads to greater exposure to adverse events; cardiovascular diseases affect the heart and blood vessels, being the leading cause of mortality worldwide, exceeding 200 deaths per 100 000 inhabitants, with 13.13 % corresponding to myocardial infarction, 2.24 % to arterial hypertension and 2.08 % to other ischemic pathology. In Latin America, they are the leading cause of morbidity, mortality, and disability 1 .
Heart failure is a prevalent syndrome indicating the terminal stage of several cardiovascular diseases; the heart does not adequately pump the blood volume to meet tissue requirements. In Western countries, it is the leading cause of hospitalization in older adults and is associated with high healthcare costs, with a hospital stay ranging from 4 to 11 days. This pathology has a poor prognosis, with a hospital mortality rate of 4-7%. The mortality rate after one year of hospitalization is 36%2
Heart failure is a prevalent syndrome indicating the terminal stage of several cardiovascular diseases; the heart does not adequately pump the blood volume to meet tissue requirements. In Western countries, it is the leading cause of hospitalization in older adults and is associated with high healthcare costs, with a hospital stay ranging from 4 to 11 days. This pathology has a poor prognosis, with a hospital mortality rate of 4-7%. The mortality rate after one year of hospitalization is 36%
It is estimated that about 23.3 million people will die from cardiovascular disease in 2030. Due to the aging population in Latin America, mortality from cardiovascular disease will increase. However, there is little information on the assessment of cardiovascular disease risk, which is defined as "a person's probability of dying or suffering major cardiocirculatory events." 1,3
Controlling cardiovascular disease is a public health priority, and predictive methods adequately designed to intervene in this pathology and guide the implementation of preventive measures and appropriate treatments are needed.
In this study, a basal ECG reading is considered, which complies with a sinus rhythm, its wave values, and
the segments that compose them. To plot the ECG in MATLAB, all this information and basal measurements are considered to obtain an ECG without cardiac pathology and through a sequence of steps to observe what happens if there is an alteration in the cardiac muscle in a given time. Heart failure is the target pathology of the algorithm that will develop in a 10-year interval in people older than 45 years who do not have any treatment.
A mathematical algorithm for predicting heart disease by spectral analysis will provide the medical sector with a solution to the severe problems caused by heart diseases since it is currently impossible to predict the development of cardiovascular problems due to the lack of suitable equipment. In this study, a series of equations are considered to model the periodic behavior of the human anatomy, one of which accurately reproduces the heartbeat in an electrocardiogram.
The purpose of deriving a mathematical algorithm to predict cardiac pathology using spectral analysis and MATLAB software involves only the QT interval. It is considered that periodic beats govern healthy hearts, so ventricular changes are called bradycardia (prolonged bradycardia) of +1 QT interval and would be deemed to have a relatively slight monthly increase, on the order of 10-4 seconds/month. The average interval before heart failure (HF) is 10 years from the first changes in the regular cardiac function QT segment.
The proposed hypothesis is: "The study of spectral analysis and using MATLAB allows the derivation of predictive algorithms for cardiology," for which it is necessary to model the phenomenon from the beginning using numerical methods based on the interpolation of each segment, whether these: curves, straight lines, waves or triangles or strange curves, and in addition, one must use least squares, LaGrange interpolation, Newton interpolation among others to obtain the graph of the ideal electrocardiogram (ECG), then consider an exponential model of cardiac physiology to modify these equations.
MATERIALS AND METHODS
Signal processing is constantly evolving to facilitate the development of science and technology. The technique of Fourier analysis of biological signals is based on the use of periodic sine and cosine functions to model the function of different organs, including the ideal electrocardiogram. "Essentially, spectral methods decompose a stationary time series into a sum of a set of sequences of cyclic components with specific properties. In general, spectral analysis is called frequency domain analysis because frequency is a measure that expresses periodicity" 4
The spectral analysis of a signal is not subject to a representation that generates results; instead, it is a sequence of analysis requiring a large amount of data. The periodic behavior of the body's heartbeat generates signals that have their components, such as amplitude, frequency, phase period, and others, which have been transformed through the Fourier series to representations called Electrocardiogram ECG, which is an electrocardiograph that records the electrical activity of the heart 5 . This research procedure makes it possible to determine different forms of cardiovascular disease and supports the identification of the condition of the heart muscles. Consequently, spectral analysis can be used in the diagnostic stage of a seasonal adjustment procedure considering the following characteristics: Different spectrum representation models (frequency units, spectral density magnitude), where the powers associated with seasonality are located, the way the spectra of specific reactions are, how filters impact the spectrum and what differences are there between the spectral representation of stationary and integrated processes.
The instrument called an electrocardiograph is connected to the patient's skin through electrodes; the latter generates the electrocardiogram on a sheet of paper, which are distinguished: the P wave corresponding to atrial depolarization, the QRS wave corresponding to ventricular depolarization and the T wave corresponding to ventricular repolarization.
The usual electrocardiogram refers to an initial spectrum in the asymptomatic QT interval. These signals are not static due to age, gender, lifestyle, and hereditary characteristics. A time series can be understood as a set of real numbers represented by a combination of sines and cosine lines (or complex exponentials). Like time series, stochastic events can be exhibited by linear combinations (especially integrals) of trigonometric or complex exponential functions, albeit weighted by random coefficients. For the calculation of the coefficients of the Fourier series that allow modeling the physiological period of a normal heart, there are several studies, as well as the programming of its operation in software such as Scilab and MATLAB.
The calculation of the series that represents the ideal behavior of the heart has been developed in such a way that its calculated coefficients are then replaced in the general formula of the Fourier Series, which allows the use of an initial graph, which serves as a basis for comparison and diagnosis based on the alterations in the different wave segments that are forming the signal of the Electrocardiogram (ECG).
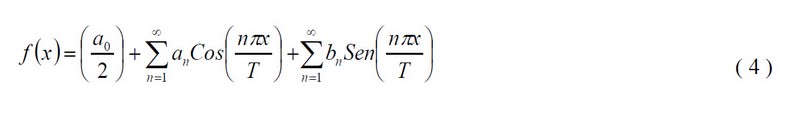
Given as the general equation of the Fourier Series:
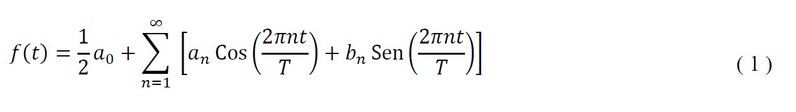
Where:
They are Fourier coefficients, is the period of the function, is the frequency of the function.
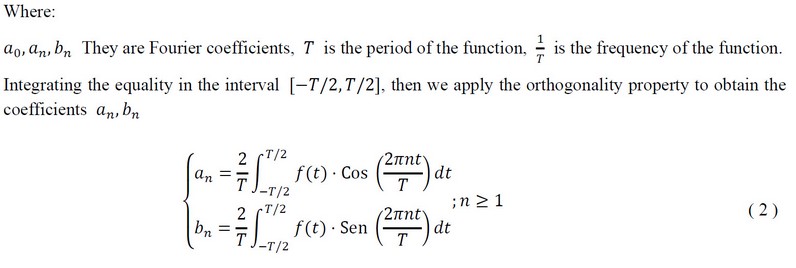
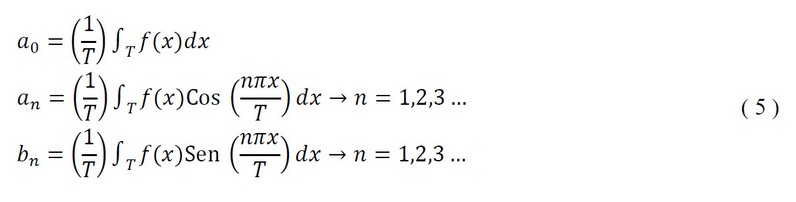
Integrating the equality in the interval , then we apply the orthogonality property to obtain the coefficients
They are Fourier coefficients, is the period of the function, is the frequency of the function.
Integrating the equality in the interval , then we apply the orthogonality property to obtain the coefficients
While the coefficient is as follows:
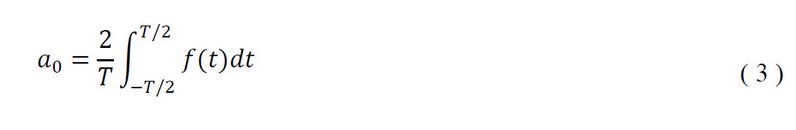
"Indeed, it may happen that for certain functions the coefficients do not exist and therefore neither does the Fourier series nor the series exists and is divergent or that although it is convergent, it does not converge to the function." 6
To analyze the signals of an electrocardiogram using the Fourier series, the spectrum analysis and the variation of its harmonics are used greatly, as well as the spectral analysis that allows the development of the present investigation.7 . "Fourier series makes it possible to describe a signal, a function of time, as a superposition of simpler signals (sinusoids) of various frequencies multiples of the fundamental frequency. 1/T. The frequency spectrum measures the distribution of amplitudes or phases of each frequency. The process that quantifies the various intensities of each frequency is known as spectral analysis." 8
Periodic signals are usually represented by a line graph parallel to the ordinate axis, which means the amplitude spectrum in the arrows of the signal.
ECG signal pre-processing technique
With the support of MATLAB software, a standard ECG signal is constructed and subjected to different alterations to draw some interesting conclusions about the effectiveness of the pathologies to be discussed in the next chapter. As a practical application, the standard values of the waves and pulses are counted to know the number of heartbeats in an ECG 9 .
The ideal ECG signal is then compressed without losing critical information. Using segmentation and normalization, the most relevant characteristics of the waveform are detected, such as the QRS complex, P and T waves, and R wave peaks.
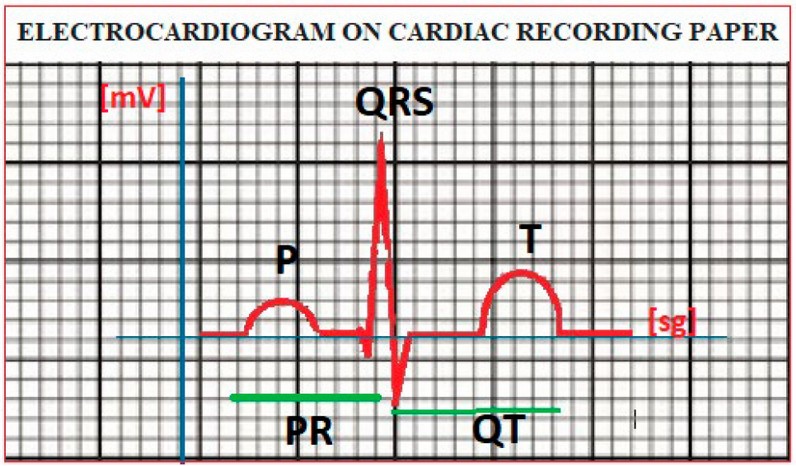
Figure 1. Code of an electrocardiogram signal using Matlab.
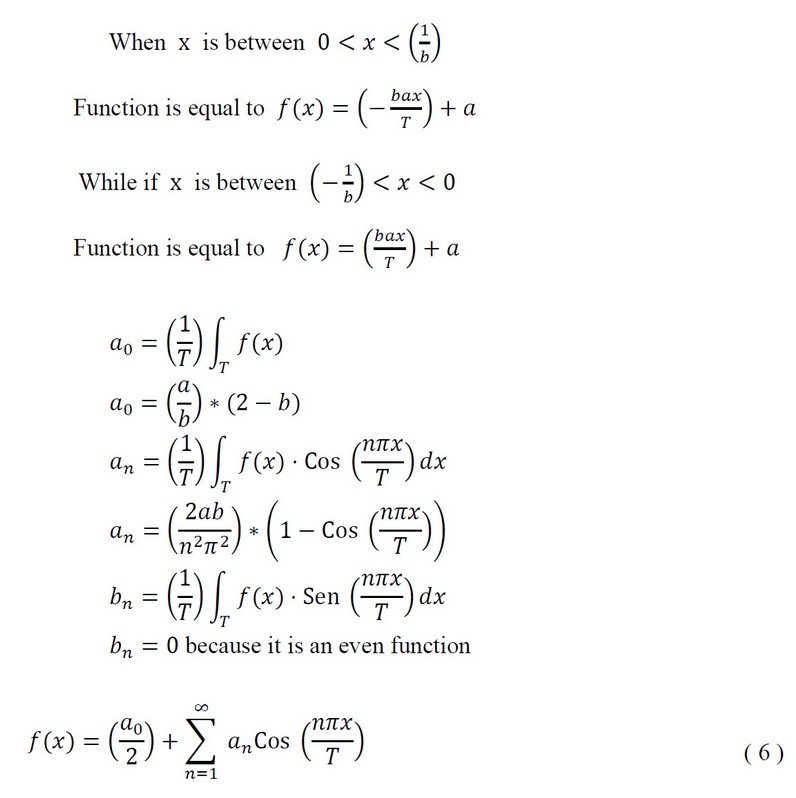
An electrocardiogram can be generated by the summation of triangular waves and half waves, which are visualized as an ideal electrocardiogram 10
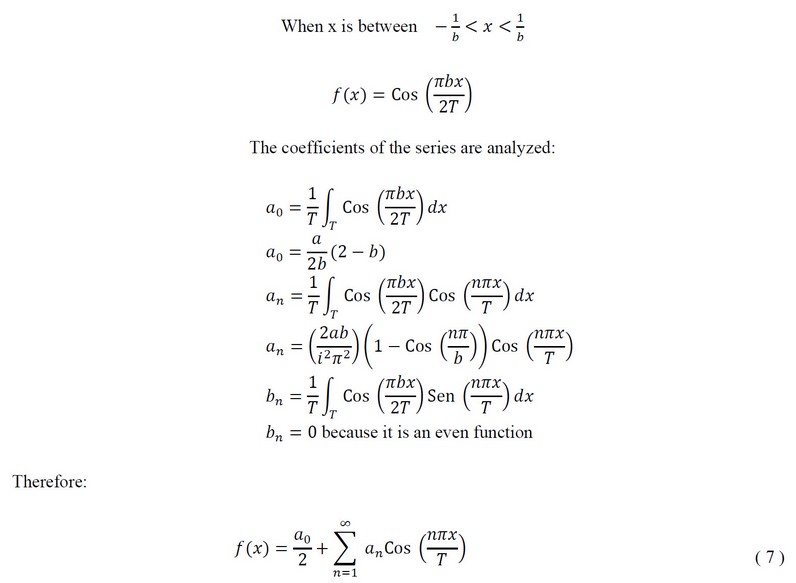
Applying the properties of the Fourier Series in the general equation, the coefficients for the triangular and half waves are derived.
Given the general equation:
Where,
Generation of periodic QRS complex portions of the ECG signal
It can be observed in an ECG period, the combination of 3 triangular waves and 2 half waves; each one of them represents the heart movement in different stages. 3 triangular waves form the QRS complex (Figure 2). 8
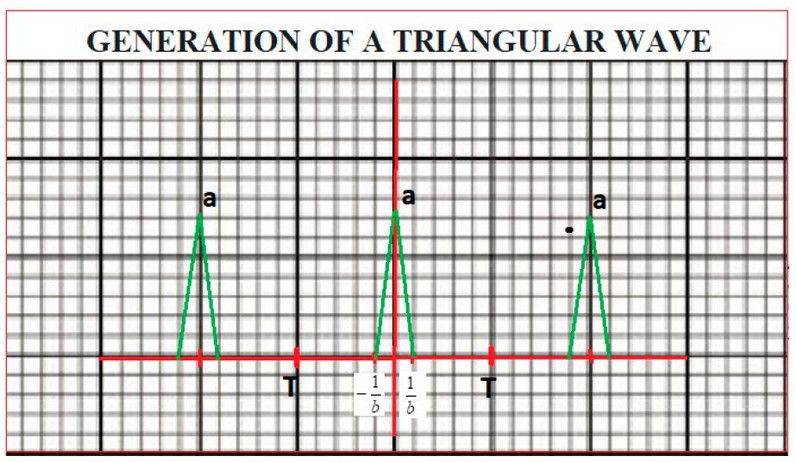
Figure 2. Data was generated to establish a triangle wave.
From equation (1), we have.
Generation of periodic P waves of an ECG signal.
It can be observed that in an ECG period, in the combination of 2 half waves, each representing the heart movement in different stages. The QRS complex (Figure 1) is formed by 2 half waves known as P wave; and T wave; 8
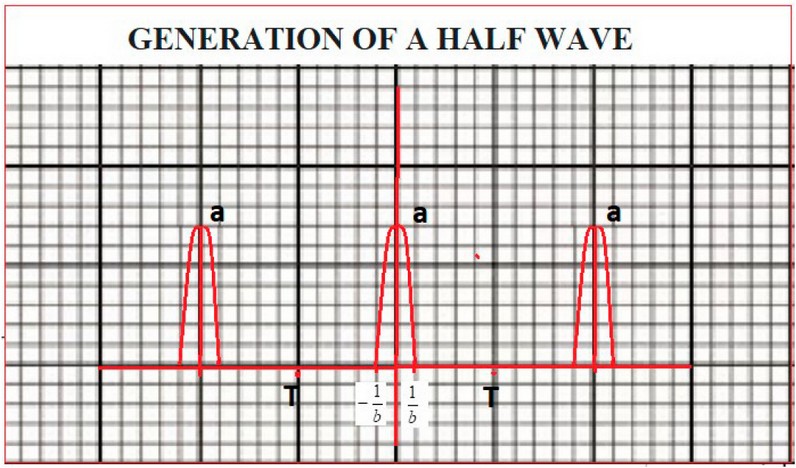
Figure 3. Data was generated to establish a half wave.
Starting from:
MATLAB and Signal Processing
Among the functions for signal processing, MATLAB has a wide variety of functions, such as ECG, convolution, matrix inversion, FFT, and DFT, among others 11 .
Fourier states that "any continuous and periodic signal could be represented as the sum of a series of properly chosen sine waves". Sine waves are generated and summed.
The tools found in MATLAB allow the analysis and implementation of digital filters, including frequency response, group delay and phase delay 5 . In addition, filters can be implemented usingechniques in the frequency domain based on the FFT function 12 .
ECG implementation in MATLAB
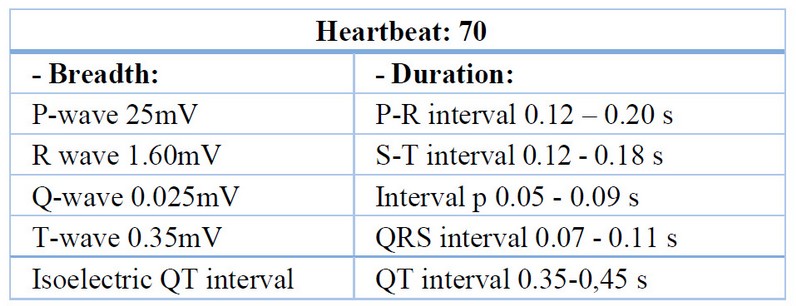
Table 1. Standard data for ECG implementation in MATLAB.
RESULTS
Finally, the results indicate that the software can diagnose, track the progression, and predict heart diseases by analyzing the QT interval on ECG graphs. Furthermore, using the Fourier series has allowed us to identify alterations in harmonics related to QT lengthening. These findings represent a significant advance in early heart disease detection and understanding its distinguishing characteristics from pathological ECG.
The study was based on the equation that models cardiac output, relating this parameter to an exponential distribution. Through this approach, we developed an algorithm capable of predicting Heart Failure (HF) over a 10-year time horizon.
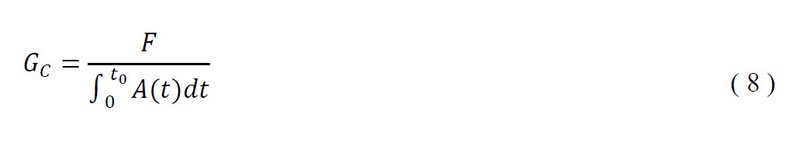
Where:
Cardiac output [beats/min].
Arbitrary dose can be a drug or dye.
Dose concentration as a function of time.
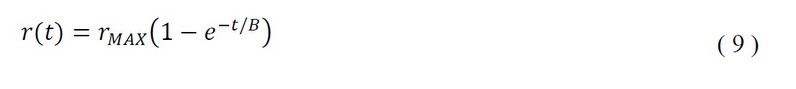
Suppose we develop the cardiac output formula that provides values within the range of 60-100 beats per minute, it is considered average in healthy individuals. Any deviation from these values, below 60 beats per minute or above 100 beats per minute, indicated cardiac pathology. We model the evolution of HF using an exponential function, the following is obtained:
Arbitrary dose can be a drug or dye.
Dose concentration as a function of time.
Suppose we develop the cardiac output formula that provides values within the range of 60-100 beats per minute, it is considered average in healthy individuals. Any deviation from these values, below 60 beats per minute or above 100 beats per minute, indicated cardiac pathology. We model the evolution of HF using an exponential function, the following is obtained:
Where:
Final stage of pathology
Initial stage of pathology
Intrinsic speed of the pathological process
Time elapsed since the onset of heart disease
Final stage of pathology
Initial stage of pathology
Intrinsic speed of the pathological process
Time elapsed since the onset of heart disease
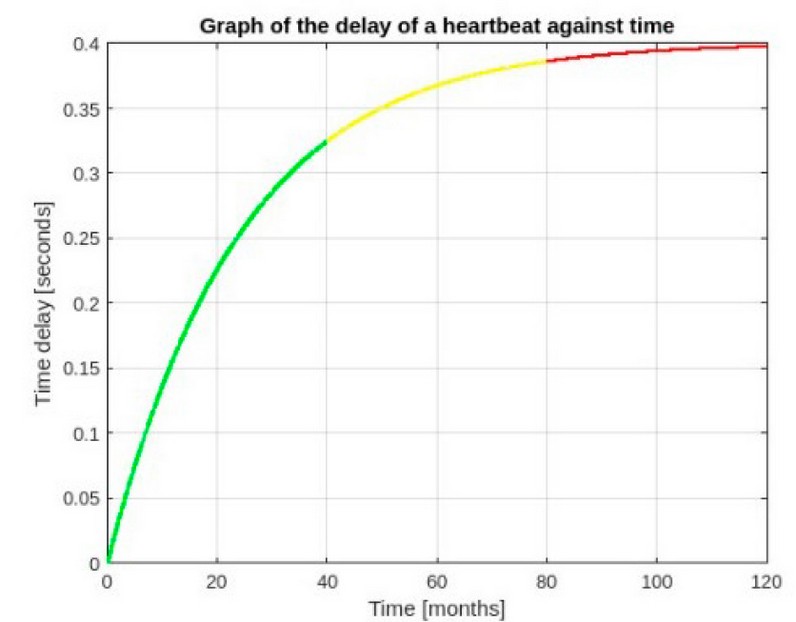
Figure 4. Stages according to the evolution of bradycardia until ending in heart failure.
The first interval, denoted in green, shows that the delay of the QT interval increases excessively, generating exponential bradycardia; it shows the exponential decay of the heartbeat (in seconds) as a function of time, evidencing the growth of the bradycardia from its onset to the first stage where the bradycardia can be reversible.
The second interval, denoted in yellow, can be observed that the QT interval delay decreases considerably, generating an onset of bradycardia close to Heart Failure; the third interval, denoted in red, can be observed that the QT interval, delay reaches its limit, generating an onset bradycardia and Heart Failure, which is entirely irreversible.
As shown in the figure, cardiac pathology tends to stabilize over 10 years, and this is because the heart begins to stop functioning, generating physiological cardiac arrest. The predictive algorithm also made it possible to generate two ECGs, one in the baseline state and the other in the pathological state.
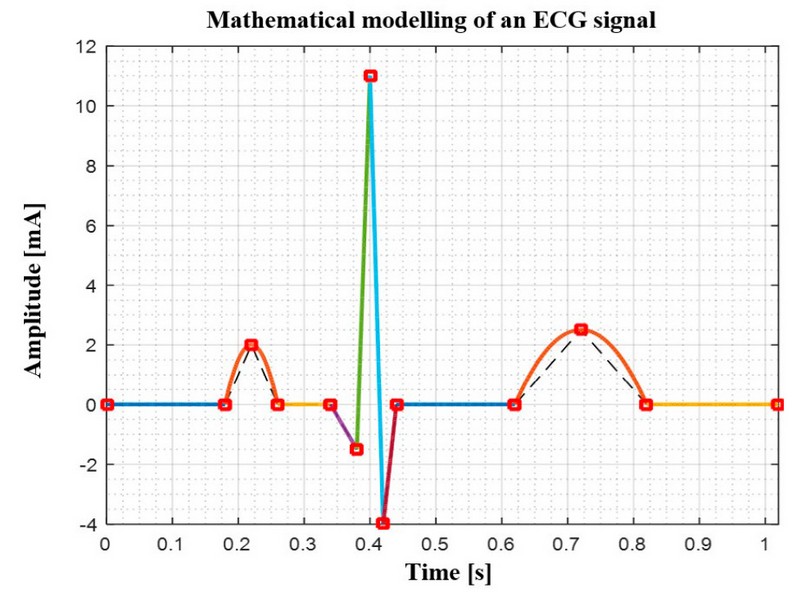
Figure 5. Normal ECG.
As can be seen, there is an ECG with its waveforms and complex with its basal characteristics.
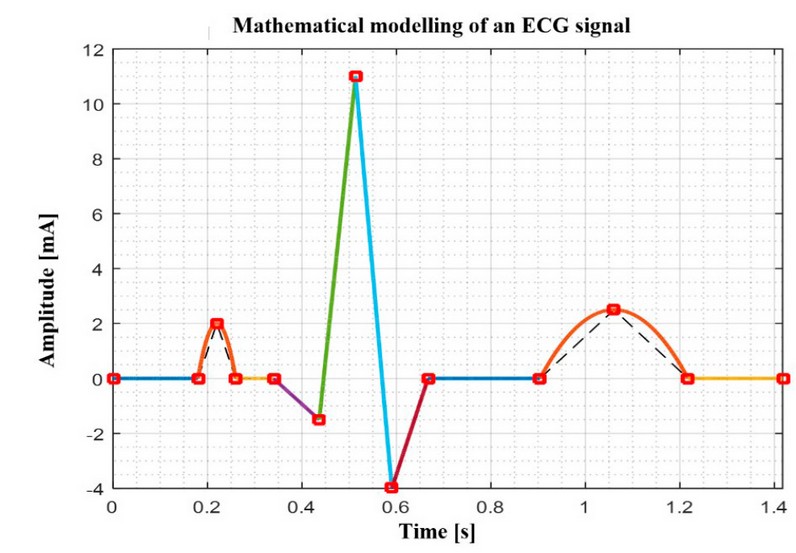
Figure 6. ECG with Heart Failure.
Although it is difficult to determine whether an ECG is normal or pathological, we can accurately observe the lengthening of the QT interval relative to the scale provided by the software. This phenomenon can be associated with pathologies such as cardiomegaly.
The analysis of the frequency spectra at months 40, 80 and 120 from different stages of the disease reveals that the variation in frequency amplitude is found in the fifth harmonic, suggesting a close relationship between this harmonic and the QT interval, as illustrated in Figures 7, 8 and 9.

Figure 7. The frequency spectrum of the signal at month 40 using harmonics and its amplitude.
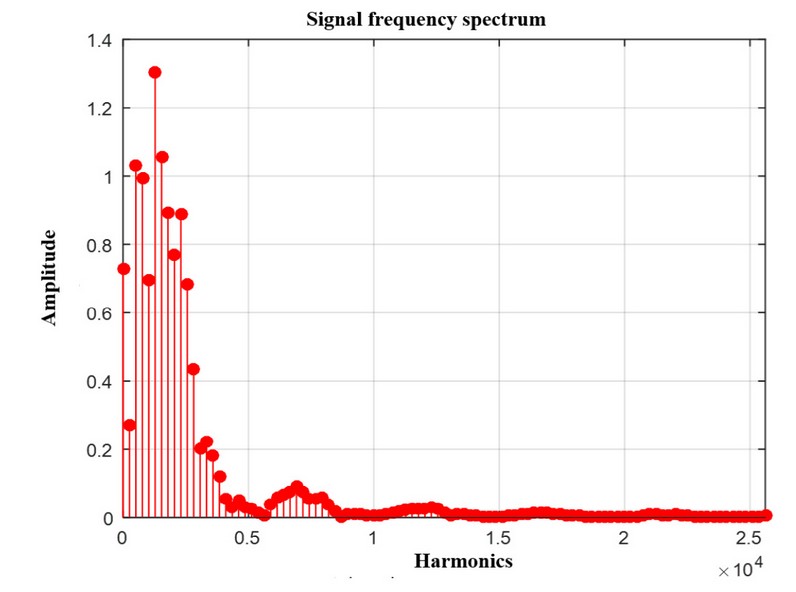
Figure 8. The frequency spectrum of the signal in month 80 using the harmonics and its amplitude.
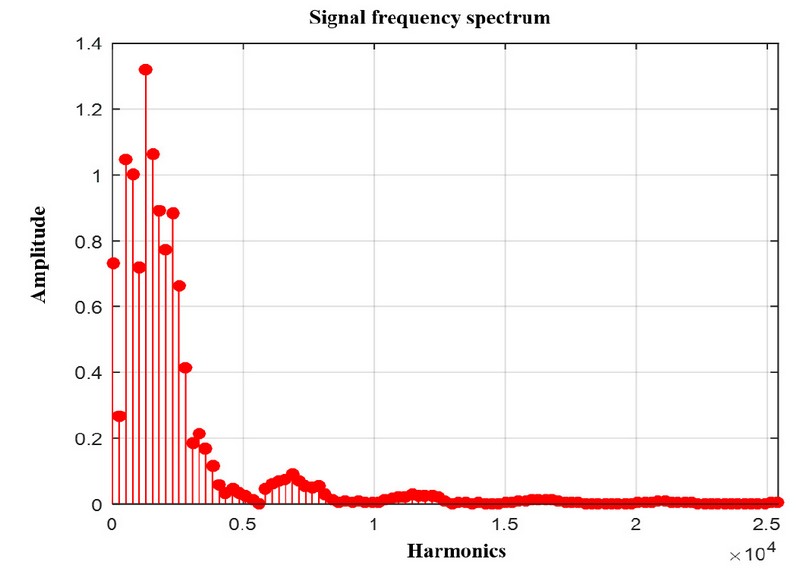
Figure 9. The frequency spectrum of the signal in month 120 using the harmonics and its amplitude.
Source: prepared by Fabián Siza.
These graphs show that the most significant variation in frequency amplitude occurs at harmonic 5, demonstrating that this harmonic is directly related to the QT interval.
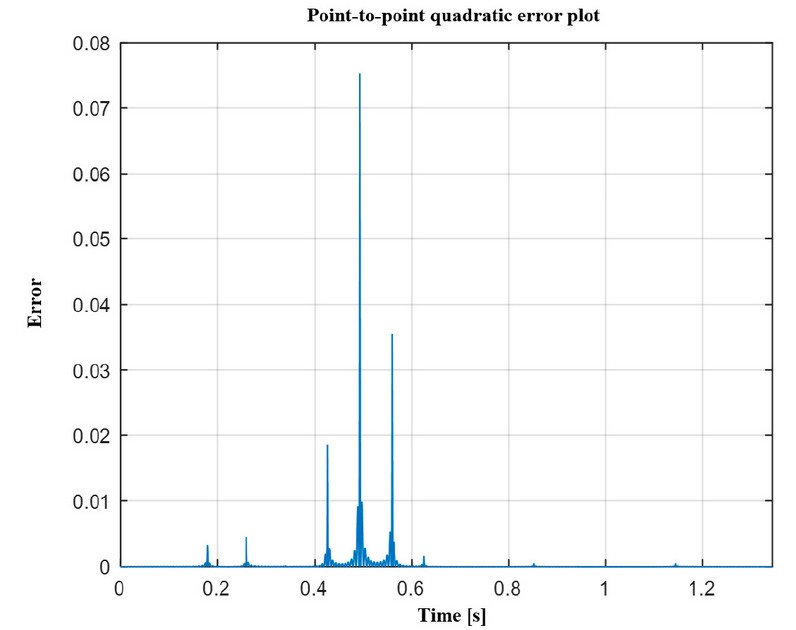
Figure 10. Quadratic error of the signal in month 40.
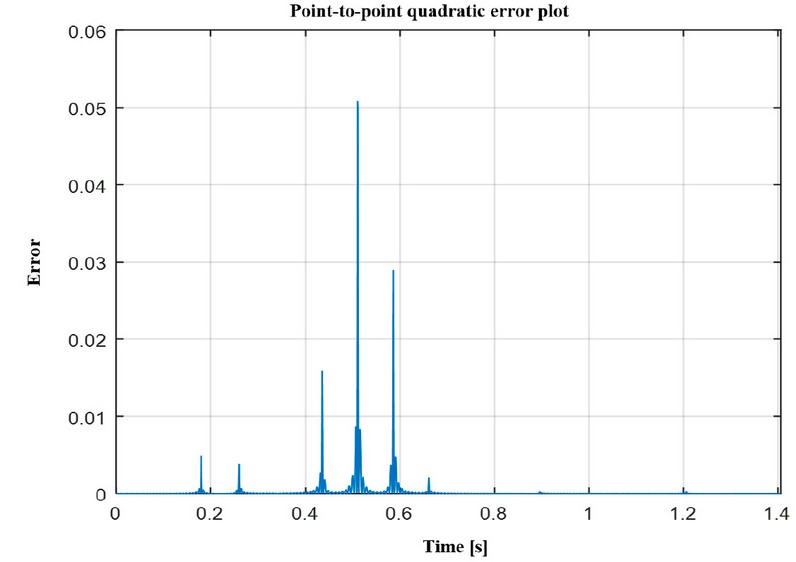
Figure 11. Quadratic error of the signal in month 80.
Figure 12. Quadratic error of the signal in month 120.
Subsequently, the mean square error between the original and the reconstructed signals was evaluated using the first 100 Fourier harmonics, as shown in Figures 10, 11 and 12. We observed that the most significant error peaks occur at the change points of intervals, specifically at 0.437, 0.514 and 0.591 seconds, corresponding to the beginning, middle and end of the QRS complex, modeled as a triangular signal.
It is important to note that, in this context, the Gibbs phenomenon is not observed. Since the 10 elements of the piecewise function do not present discontinuities. The most notable errors occur due to transitions between intervals, which are directly related to the change in the triangular signal that represents the QRS complex.
In summary, the research provides a solid basis for the prognosis of HF using a mathematical approach and Fourier series analysis in ECG. The results obtained suggest a clear relationship between the fifth harmonic and the QT interval, which may have significant implications in the early detection or diagnosis of this heart
disease.
The software, designed to measure the QT interval on electrocardiograms (ECG), has proven to be a valuable tool for diagnosing, tracking the progression, and predicting heart disease. Through this software, we have created a graphic representation that identifies three heart disease stages of evolution: the health phase, the onset phase, and the advanced phase13 . This program, therefore, provides an accurate view of the patient's health status based on the measured graphs of their ECG.
Using the Fourier series analysis, we carefully examined the harmonics in ECGs, comparing standard QT signals with those of patients with QT prolongation. Our approach has allowed us to identify which harmonics are related to QT segment prolongation and how they are altered in pathological conditions. Fourier series analysis and programming have provided a detailed understanding of these alterations, a result that is generated from the following algorithm:
Lines of code
Finally, the results indicate that the software can diagnose, follow the progression of, and predict cardiac diseases by analyzing the QT interval in ECG graphs. In addition, using the Fourier series has also allowed us to identify alterations in the harmonics related to QT lengthening accurately. These findings represent a significant advance in the early detection of cardiac disease and understanding its distinguishing features from pathological ECG.
DISCUSSION
The research focuses on the prediction of heart failure through spectral analysis of ECG signals, which is of great relevance in Latin America, where cardiovascular diseases represent the leading cause of morbidity and mortality, as mentioned by 1 . Our contribution aligns with this concern for heart health and provides a specific tool to predict heart failure, a crucial step in preventive healthcare. This approach goes beyond observing alterations in the cardiac muscle in a given time, as suggested by 13, since we use spectral analysis to distinguish between normal ECGs and pathological ECGs, improving the accuracy of clinical diagnosis.
Theoretically, the concept of frequency domain analysis, introduced by 4 , is fundamental in our research, as we share his focus on the spectral analysis of signals. This allows us to decompose ECG signals into cyclic components and to detect subtle differences in pathological ECGs. In addition, 5 points out the transformation of ECG signals through the Fourier series, a method related to our approach. However, our research focuses on heart failure prediction, which goes beyond simple signal transformation.
On the other hand, the study also validates the importance of spectral analysis, as highlighted by 7 , by demonstrating that specific harmonics, such as harmonics 5 and 7, are particularly sensitive to differences between normal and pathological ECGs. Although we did not directly address the counting of standard values of waves and pulses in an ECG, as suggested by 9 , we consider that this measure could be integrated into future research to improve the accuracy of our prediction of heart failure. Furthermore, the approach of Siza, Cazar, and Cortez (2013) 14 in generating an electrocardiogram from triangular and half-waves could enrich future studies in ECG signal modeling.
The basis in the equation that models cardiac output could provide a useful framework for understanding changes in cardiac function related to heart failure and should be considered in future research. Finally, the research brings additional value to the early detection of heart disease. It contributes to understanding the distinctive features of pathological ECGs, which could improve preventive healthcare and treatments for patients at risk of heart failure.
CONCLUSIONS
The study is based on mathematical models and equations to represent the behavior of the heart muscle over time, and its fundamental premise is the identification of an algorithm that uses QT interval widening in electrocardiograms to predict heart failure, which promises to be an innovative tool in cardiovascular medicine and biomedical engineering. In addition, spectral analysis has proven to be an effective tool for the study of electrocardiograms. It has enabled the development of an advanced algorithm for predicting heart failure, offering a new perspective in the early detection of this disease. The application of the Fourier series to biological models, such as the heartbeat, has been fundamental in understanding the evolution of heart failure, revealing significant changes in the coefficients of the Fourier series correlated with the progression of cardiac pathology; furthermore, it has been observed that harmonics 5 and 7 are particularly sensitive to the differences between a normal ECG and a pathological one, which makes them essential for the diagnosis and prognosis of heart failure. This study represents significant progress toward developing a predictor of heart failure in young adults. It focuses on analyzing electrocardiograms over 10 years, providing a potentially valuable tool for detecting this cardiovascular condition in its stages. Early. In addition to its relevance in the early detection of heart failure, the proposed predictor could be a valuable tool for public health by contributing to the diagnosis of alterations in the QT interval that often go unnoticed, which could lead to preventive medical care and more effective treatment for patients at risk. This research represents a significant step in improving preventive healthcare and treatment of patients at risk for heart failure, potentially substantially impacting public health and quality of life for people in Latin America as in other places of the world.
Funding: "This research did not receive external funding."
Conflicts of interest: "The authors declare no conflict of interest."
REFERENCES
1. Orellana R, Portillo I, Villarroel M. Calculadoras de riesgo cardiovascular como estrategia preventiva de eventos isquémicos en la población de Latinoamérica. ALERTA 2021;
2. Farmakis D, Parissis J, Lekakis J, Filippatos G. Insuficiencia cardiaca aguda: epidemiología, factores de riesgo y prevención. Rev Esp Cardiol [homepage on the Internet] 2015;68(3):245–248. Available from: https://www.sciencedirect.com/science/article/pii/S0300893214006563
3. Sisa I. Evaluación del riesgo cardiovascular en adultos mayores utilizando el modelo SCORE OP en una población latinoamericana: experiencia en Ecuador. Med Clin (Barc) [homepage on the Internet] 2018;150(3):92–98. Available from: https://www.sciencedirect.com/science/article/pii/S0025775317306498
4. Gonzales Gomez D. ANÁLISIS ESPECTRAL: CONSIDERACIONES TEÓRICAS Y APLICABILIDAD. Economía y Sociedad 2001;16(Economía y Sociedad):45–60.
5. Martínez I, Andrea P, Abaunza M. Procesamiento y análisis de señales electrocardiográficas (ECG). Publicaciones e Investigación [homepage on the Internet] 2022 [cited 2023 Sep 27];16(4). Available from: https://hemeroteca.unad.edu.co/index.php/publicaciones-e-investigacion/article/view/6496
6. Medina J. ANALISIS DE FOURIER PARA EL TRATAMIENTO DE SEÑALES. https://www.academia.edu/15454387/ANALISIS_DE_FOURIER_PARA_EL_TRATAMIENTO_DE_SE%C3%91ALES. 2010;1–39.
7. Tenorio ED, López PG, García JCS, Hernández MC, González LH. Generación de señales ECG con funciones de fourier en un microcontrolador de arquitectura ARM 32. Ciencia Latina Revista Científica Multidisciplinar [homepage on the Internet] 2023 [cited 2023 Sep 27];7(2):10022–10035. Available from: https://ciencialatina.org/index.php/cienciala/article/view/6098/9260
8. Medina J. ANALISIS DE FOURIER PARA EL TRATAMIENTO DE SEÑALES. https://www.academia.edu/15454387/ANALISIS_DE_FOURIER_PARA_EL_TRATAMIENTO_DE_SE%C3%91ALES. 2010;1–39.
9. Araújo NM de, Oliveira EDS, Silva BVS da, Melo EBB de, Dantas RAN, Dantas DV. AUDIOVISUAL AIDS IN PREOPERATIVE CARDIAC SURGERY EDUCATION: A SCOPING REVIEW. Texto e Contexto Enfermagem 2022;31.
10. Siza R, Cazar D, Cortez M. ANÁLISIS DE SEÑALES CARDIOVASCULARES UTILIZANDO TÉCNICAS DE PROCESAMIENTO DIGITAL DE SEÑALES. PERFILES 2013;44–48.
11. Gonzalez R, Gianmarco V-L. Desarrollo de una interfaz gráfica para el cálculo de series de Fourier en Matlab. Revista Científica: BIOTECH AND ENGINEERING [homepage on the Internet] 2021 [cited 2023 Sep 27];1(02):41. Available from: https://revistas.untels.edu.pe/index.php/files/article/view/15
12. Casado M. MANUAL BÁSICO DE MATLAB. http://webs.ucm.es/centros/cont/descargas/documento11541.pdf. :1–62.
13. Sarmiento WCH, Mora G, Vanegas P. Prevención y manejo de la hipertrofia ventricular izquierda en pacientes adultos obesos. MQRInvestigar [homepage on the Internet] 2023 [cited 2023 Sep 27];7(2):342–357. Available from: https://www.investigarmqr.com/ojs/index.php/mqr/article/view/343
14. Siza R, Cazar D, Cortez M. ANÁLISIS DE SEÑALES CARDIOVASCULARES UTILIZANDO TÉCNICAS DE PROCESAMIENTO DIGITAL DE SEÑALES. PERFILES 2013;44–48.
Received: October 9th 2023/ Accepted: January 15th 2024 / Published:15 February 2024
Citation: Siza Moposita S F, Sáez Paguay M Á, Fiallos Godoy Y M, Ricardo Fabián S G, Heart failure prognostic algorithm using Spectral Analysis and MATLAB software. Bionatura Journal 2024; 1 (1) 12. http://dx.doi.org/10.21931/BJ/2024.01.01.12
Additional information Correspondence should be addressed to fabian.siza@espoch.edu.ec
Peer review information. Bionatura Journal thanks anonymous reviewer(s) for their contribution to the peer review of this work using https://reviewerlocator.webofscience.com/
All articles published by Bionatura Journal are made freely and permanently accessible online immediately upon publication, without subscription charges or registration barriers.
Publisher's Note: Bionatura Journal stays neutral concerning jurisdictional claims in published maps and institutional affiliations.
Copyright: © 2024 by the authors. They were submitted for possible open-access publication under the terms and conditions of the Creative Commons Attribution (CC BY) license (https://creativecommons.org/licenses/by/4.0/).