
Detection of arsenic and lead ions in water through validation of the electrothermal atomic absorption method

Tannia Vargas-Tierras1, Vanessa Morales-León2, Sharon Andi-Barrera 3, Rubén Toapanta-Topón 3, María Morales-León4, Lissette Segovia-Tello5, Viviana Lara-Villegas6 *
1 Research Group YASUNI-SDC, Sede Orellana, (Escuela Superior Politécnica de Chimborazo / El Coca 220001 / Ecuador);
tannia.vargas@espoch.edu.ec;
2 Research Group GIMA, Facultad de Recursos Naturales, (Escuela Superior Politécnica de Chimborazo / Riobamba 060106 / Ecuador; vanessa.moralesl@espoch.edu.ec;
3 Tesista: Escuela Superior Politécnica de Chimborazo, Sede Orellana; sharonandi1999@gmail.com;
3 Tesista: Escuela Superior Politécnica de Chimborazo, Sede Orellana; rjtoapanta.28@gmail.com;
4 Investigador independiente; m.augustamorales@gmail.com;
5 Investigador independiente; lissegoviatello@hotmail.com;
6 Investigador independiente; vivispaty2626@hotmail.com;
* Correspondence: tannia.vargas@espoch.edu.ec; +593 992708639.
Available from. http://dx.doi.org/10.21931/BJ/2024.01.01.8
ABSTRACT
The validation of the electrothermal spectrometry method for Arsenic and lead determination in water samples guarantees the quality of analytical data. The study was carried out at AQLAB. A theoretical and technical investigation was applied to ensure the reliability and accuracy of the analytical method. Parameters such as INEN standards, Eurachem international standards, AQLAB internal documents and environmental standards were used to validate the process. Several readings were performed on different samples to make calibration curves for As and Pb, evaluate the method's linearity, and obtain information on the slope, intercept and determination coefficient. Statistical calculations were used to determine the limit of detection and quantification, repeatability, reproducibility, trueness and uncertainty. The results show that the hypotheses were fulfilled, calibration curves with determination coefficient higher than 0.995, repeatability standard deviation lower than 16%, calculated F < critical F (4.96), calculated t student < theoretical (2.23), trueness was between 100.29-110.18 and 99.64-107.92%, uncertainty was 20% range 0.005 to 0.10 mg/L and 15% range 0.01-0.20mg/L, limit of detection was 0.001 and 0.005 mg/L and limit of quantification was 0.01 and 0.02mg/L, respectively. Therefore, the validation method was robust and accurate.
Keywords: water samples, analytical data, reliable results, Arsenic, Lead, validation.
INTRODUCTION
Atomic absorption spectroscopy (AAS) is a technique based on the measurement of the amount of light absorbed by free atoms in the sample, allowing the precise identification and quantification of the elements present; it has gained tremendous popularity in analytical chemistry due to its high sensitivity and a relative absence of interferences in the determination of most metals and metalloids1.
One spectroscopy method is electrothermal atomic absorption (EAA), an analytical technique determining the concentration of metallic elements in liquid samples2. Electrothermal atomization using a graphite tube furnace as an atomizer is a powerful and advantageous technique in atomic absorption spectroscopy because it allows analysis of refractory and trace analyte elements3, uses smaller samples, and provides higher sensitivity, making it a preferred choice in many analyses4.
The advantages of AAE are that it offers much lower detection levels (20 to 1000 times better) than conventional flame techniques, can analyze the sample without additional treatment and requires a minimum amount of sample to perform the analysis1. On the other hand, it has limitations such as greater susceptibility to interferences (precision of the results), longer analysis time and sensitivity to contamination 5,6.
For this reason, atomic spectrometry is an analytical technique that makes it possible to detect and quantify the presence of Lead and Arsenic in different samples, essential for understanding their impact on human health and the environment5. Lead poisoning is a significant public health problem, and continued research is crucial to comprehend its effects better and to develop effective strategies to prevent and control lead exposure7.
Lead contamination in surface, ground and drinking water is a global problem that has become more evident and problematic in the last decade due to increased public awareness, stricter regulations, scientific research and concerns about human health and the environment8. Lead exposure is linked to a variety of health problems. It is especially alarming for children, as no safe blood lead level and severe cognitive health effects have been found, which can adversely affect children's mental development and academic performance9. The US Environmental Protection Agency (EPA) has established an action level for Lead in drinking water of 15 μg/L; this action level is not designed to measure health risks but as a potential point at which additional measures should be taken7,8.
On the other hand, Arsenic is a ubiquitous element that, in some geographical regions, arsenic concentrations can be significantly high10 and, in such situations, represents a severe risk to human health because it can present genotoxic and carcinogenic effects11. The World Health Organization (WHO) considered a limit of 10 µg/L for Arsenic as a guideline for drinking water, while the standard in Iran is 50 µg/L12,13.
For this reason, validating the electrothermal atomic absorption spectrometry method is essential to characterize the presence and concentration of Lead and Arsenic in water, especially within the province of Orellana, so that adequate measures can be taken to address contamination, reduce health risks and protect the most affected populations.
MATERIALS AND METHODS
The study was conducted at the Environmental Analysis and Evaluation Laboratory "AQLAB," located at 0279263 latitude and 9948509 longitude (UTM coordinates) in the Francisco de Orellana canton, Orellana Province. The average temperature inside the laboratory is 25°C, and the relative humidity is 85%.
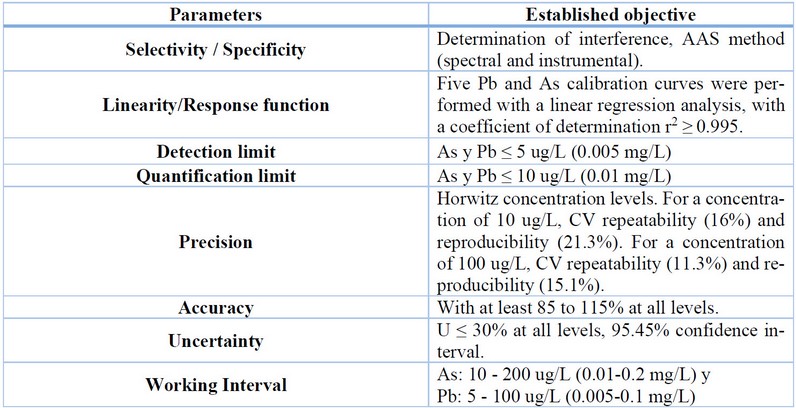
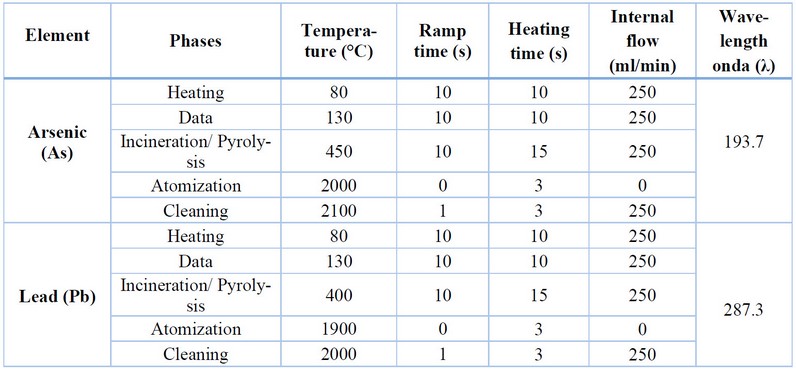
A rigorous process of theoretical and technical research was carried out to ensure the reliability and accuracy of the analytical method. The theoretical research involved the study of relevant bibliographic sources, such as national standards of the Ecuadorian Accreditation Service, according to INEN NTE ISO/IEC 17025:201814, international standards, such as Eurachem, provides guidelines for method validation15 and internal laboratory documents"AQLAB"16, PG-AQLAB-07 for method validation (Table 1), PG-AQLAB-06 for uncertainty calculation, ITU-AQLAB-10 instructions for the use of graphite furnace and the ITE-AQLAB-96 for determination of metals in water by graphite furnace. The standard INEN 1108 the ministerial agreement 097A to establish the theoretical basis for the experiment design and the analytical need. For the technical part, validation of the metals (Arsenic and Lead), the electrothermal atomic absorption spectrometric method was used (Perkin Elmer-800-EFQ-086) (Table 2), preliminary filtration, preliminary metal digestion and nitric acid digestion, using Standard Methods for the Examination of Water and Wastewater APHA 3113 B, 3030 B, 3030 D, 3030 E, respectively.
Fuente: AQLAB16.
Table 1. Parameters for evaluating methods for As y Pb con PG-AQLAB-06 y 07.
Fuente: AQLAB16.
Table 2. Optimal temperature and ramp time parameters for determining As y Pb con Perkin Elmer-800-EFQ-086.
The reagents used were As stock standard: 1 000 000 ug/L arsenic solution, Pb stock standard: 1 000 000 ug/L lead solution, inert gas: high purity argon ≥ 98%, distilled water: type I conductivity less than 2 uS/cm and pH 7.00, nitric acid: HNO3 grade HPLC, HNO3 2% solution: 2.9 of 70% concentrated HNO3 was dissolved in 1 liter, As and Pb working standard: prepared from the respective stock standard of each metal. 0.125 mL of the stock solution was diluted in a 250 mL volumetric ball with 2% HNO3 solution; the concentration of this solution was 500 ug/L. These standards and prepared solutions are crucial for accurate and reliable measurements of Arsenic and lead in water samples by electrothermal atomic absorption spectrometry.
Water samples for the determination of the presence of Arsenic (As) and Lead (Pb) were taken from the drinking water network (ACH) at the AQLAB Laboratory, the wastewater treatment plant (A.NYG) of the Autonomous Decentralized Municipal Government of Francisco de Orellana (GADMFO), and natural water (A.NAT) from the Payamino River. Fortified samples were also used (water sample + known concentration of the analyte): ACH + 10 ug/L solution of As or Pb, A.NAT + 20 ug/L As solution, A.NYG + 30 ug/L As solution, A. NAT + 30 ug/L Pb solution, A.NYG + 100 ug/L Pb solution. Control standard - STD CNTRL 25 ug/L As and 5 ug/L Pb, working standard-STD 200 ug/L As; reference material-MR-28 (121 ug/L ± 2 arsenic and 1 079 ± 10 ug/L lead). The methodology of technical standard INEN 2226: 2013 was followed13 for collecting water samples.
Standards were prepared according to ITE-AQLAB-96. Starting with the 1,000,000 ug/L standard for As and Pb, a working standard of 500 ug/L was organized, then a standard of 50 ug/L was prepared. Subsequently, the atomic absorption spectrophotometer was configured to schedule 4 more standards automatically with concentrations of 5, 10, 20, and 40 ug/L from the last standard prepared (50 ug/L).
For the readings of ACH, A.NYG, A.NAT, fortified samples, STD CNTRL, MR-28 and working STD. 2 analysts performed data, and 6 data were taken with a maximum of 6 levels.
Five readings (5 days) of the four concentration levels established in the working interval were taken, and statistical analysis was performed. To analyze the response function and linearity, the calibration curve standards (5, 10, 20 and 40 ug/L) were prepared, then the absorbance data of the different concentrations were recorded. Finally, the linear estimation of the slope (m), intercept (b), "y" type error (Sxy), "x" type error (Sxx), standard deviations of the slope (Sm) and intercept (Sb) and the confidence inter-values of the curves was performed.
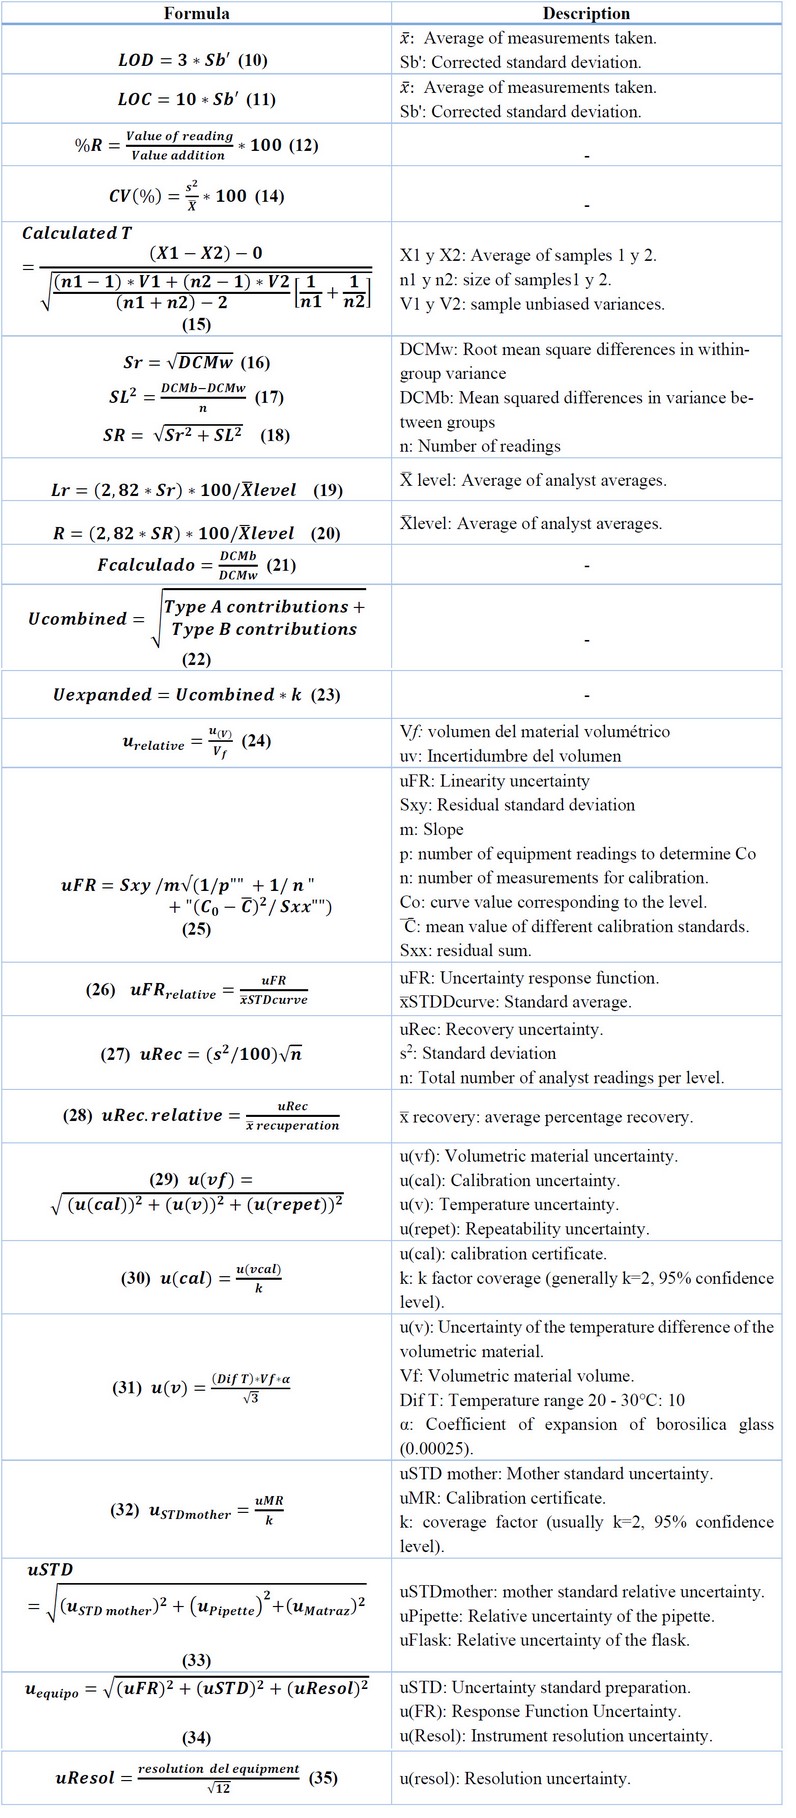
The limits of detection and quantification were calculated with equations 10 and 11 (Table 3). For repeatability analysis, the readings of the fortified samples, control standards and reference material were used, and the average (x̅), standard deviation (s2) and coefficient of variation (CV%) were calculated by applying equation 14 (Table 3). For the determination of trueness, the fortified samples were used, obtaining from them the percentage recovery (%R) by applying equation 12 (Table 3); here, the value of the reading, standard addition value and multiplied by 100 was added. Subsequently, the x̅ of recovery of the total of the readings performed by the 2 analysts was determined. For the calculation of reproducibility, the data of the fortified samples per analyst were used and x̅ and variances (VAR) were selected. The t-calculated (t-c) was determined with equation 15 (Table 3) and was performed with the value of the t-theoretical (t-t) with 0.05 probability and 10 degrees of freedom and finally with the results the condition that t-calculated < t-theoretical was checked.
To determine the precision, the sums and quadratic differences were calculated, then with these results, the standard deviation of repeatability (Sr) was estimated with equation 16, intermediate precision (SL2) with equation 17, and the standard deviation of reproducibility (SR) with equation 18. Then, repeatability limits (Lr) and reproducibility (LR) were calculated with equations 19 and 20, respectively. Finally, a comparison was made between the calculated Fisher's value (calculated F) equation 21 and the result of the analysis of variance (ANOVA) to observe similarity and to be able to continue validating the methods. The uncertainty calculations of the response function, trueness, volumetric material, mother standard, working standards and equipment calibration were performed with equations 22 to 35.
To determine the precision, the sums and quadratic differences were calculated, then with these results, the standard deviation of repeatability (Sr) was estimated with equation 16, intermediate precision (SL2) with equation 17, and the standard deviation of reproducibility (SR) with equation 18. Then, repeatability limits (Lr) and reproducibility (LR) were calculated with equations 19 and 20, respectively. Finally, a comparison was made between the calculated Fisher's value (calculated F) equation 21 and the result of the analysis of variance (ANOVA) to observe similarity and to be able to continue validating the methods. The uncertainty calculations of the response function, trueness, volumetric material, mother standard, working standards and equipment calibration were performed with equations 22 to 35.
Fuente: AQLAB16.
Table 3. Equations for statistical analysis.
RESULTS
The validation of methods for the determination of heavy metals is fundamental because it allows us to obtain accurate results that serve to take corrective measures in the short, medium and long term. For the validation of the method for Arsenic in water, six readings were performed per analyst, using different concentrations of standards for water samples and reference material, resulting in a total of six concentration levels (Table 4).
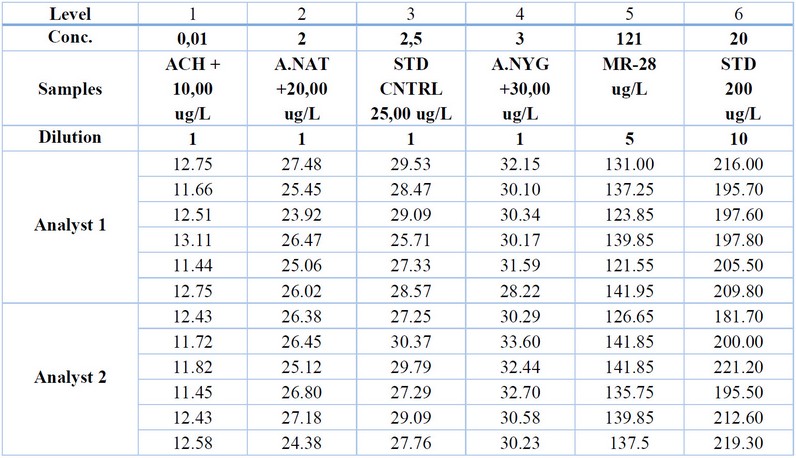
Table 4. Initial data was used to validate the method for determining arsenic levels in water.
The results of the method validation for the determination of Arsenic show the five calibration curves in absorbance units for each of the concentrations from 5 to 40 ug/L. The coefficient of determination of 0.9983 represents the high correlation, therefore, the calibration curves are accepted (Figure 1).
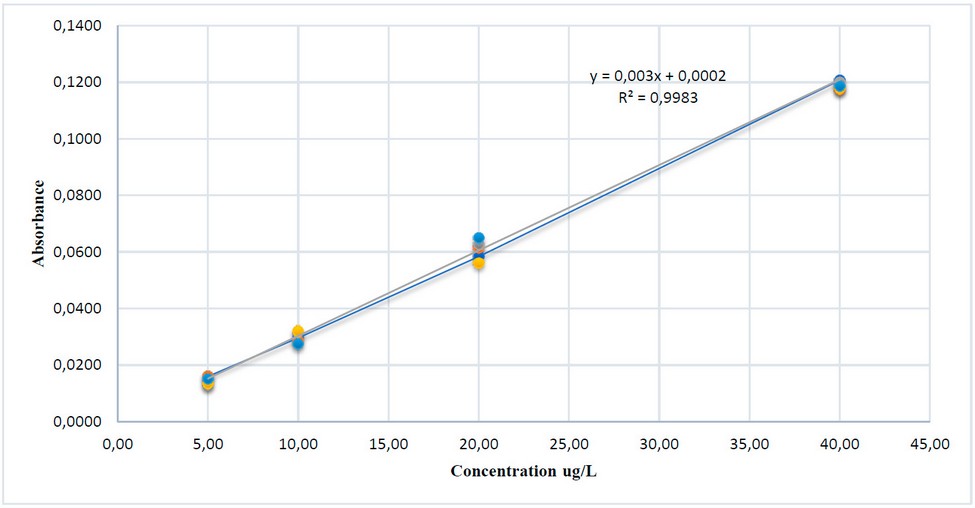
Figure 1. Linearity of the arsenic calibration curve.
Determining the maximum and minimum values of the five calibration curves allowed obtaining maximum values (0.00363 and 0.01532) and minimum values (0.00234 and -0.01464) as a control to control the curves during and after the process.
In the repeatability analysis (r) a CV of less than 7% was obtained in the six levels (ACH + 10.00 mg/L, A.NAT +20.00 ug/L STD CNTRL 25.00 ug/L, A.NYG +30.00 ug/L, MR-28 ug/L, STD 200 ug/L), analyst 1: 5.39, 4.76, 4.95, 4.94, 6.43 and 3.97 % and analyst 2: 3.87, 4.12, 4.70, 4.78, 4.17 and 7.50 %; these results are accepted because they comply with the validation objectives, being less than 16%. When performing the trueness analysis of the 12 readings, it was determined that the average maximum value was 113.42%, a value that is within the values established to accept the validation method. The reproducibility analysis (R) shows that the calculated t (0.90217, 0.48124, 0.60436, 0.60436, 0.60436, 1.11948 and 0.18649) was < t - theoretical (2.22814) in the six levels, therefore the validation of the method is accepted. The precision analyses at the six levels show that the calculated F (1.38792, 0.22927, 0.01784, 2.21193, 0.22004 and 0.37874) is < tabulated F (4.96460); therefore, the validation method is accepted. The values of response function uncertainty (uFR) was 0.546, uFR relative (0.02910), ucal (0.0028), u(V) (0.0721), urelative 50mL (0.0014), As 1 000 000 ug/L mother standard (0.0012), As mother standard relative U (0.000012), ustd 50 ug/L (0. 0014), uteam (0.02919), uresol (0.000289) and in the six levels the values obtained in ucombined (0.6772, 1.4560, 1.5984, 1.8366, 7.3397 and 12.3184) and uexpa (14, 15, 13, 12, 12, 12 and 12 %), these last values for being ≤ 30% the validation is accepted.
For the lead validation method, six readings were performed by each analyst with different concentrations of standards for water samples and reference material, resulting in a total of five concentration levels (Table 5).
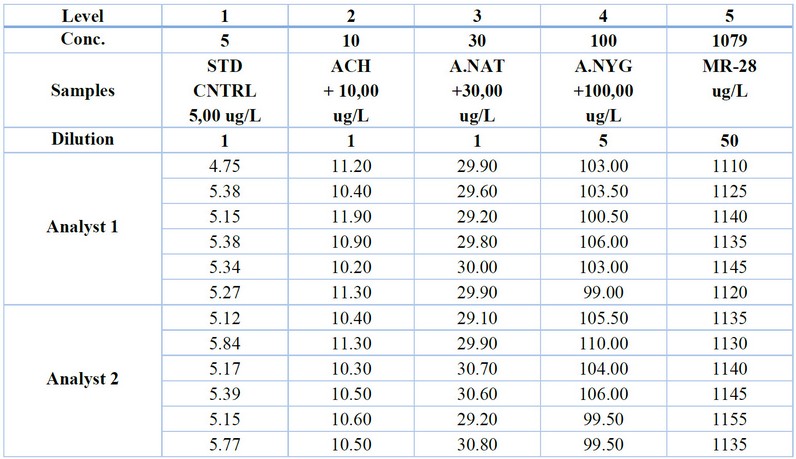
Table 5. Initial data was used to validate the method for determining Lead in water.
The validation of the method for determining Lead shows the five calibration curves in absorbance units for each concentration from 5 to 40 ug/L. The high correlation represented by the determination coefficient of 0.9999 indicates that the electrothermal atomic absorption spectrometry method is accurate and suitable for determining Lead in water for the range of concentrations evaluated (Figure 2).
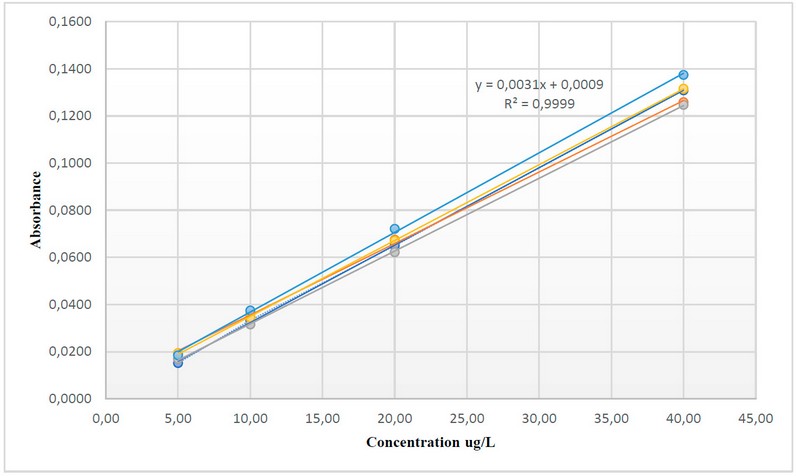
Figure 2. Linearity of the lead calibration curve.
Determining the maximum and minimum values of the five calibration curves allowed obtaining maximum values (0.00364 and 0.01109) and minimum values (0.00278 and -0.00370) as a control to control the curves during and after the process.
In the repeatability analysis (r) the CV was less than 6% at all five levels (STD CNTRL 5.00 ug/L ACH + 10.00 ug/L, A.NAT +30.00 ug/L, A.NYG +100.0 ug/L, MR-28 ug/L) (analyst 1: 4. 65, 5.68, 0.99, 2.39 and 1.17% and analyst 2: 5.99, 3.38, 2.55, 3.91 and 0.78 %); these results are accepted because they comply with the validation objectives, less than 16%. The trueness analysis of the 12 readings determined that the average maximum value was 107.92%, a value that is accepted in the validation. The reproducibility analysis (R) shows that the calculated t (1.18714, 1.31162, 0.94981, 0.82099 and 1.67286) was < t - theoretical (2.22814) in the five levels, therefore the validation of the method is accepted. The precision analyses at the five levels show that the calculated F (1.39521, 1.70316, 0.89312, 0.66728 and 2.77049) is < tabulated F (4.96460) therefore, the validation method is accepted. The values of the uncertainty of response function (uFR) was 0.794, uFR relative (0.04235), ucal (0.0042), u(V) of 250 ml (0.3608), urelative 250 ml (0.0014), U std mother lead (0.0012), mother standard relative U (0.000012); ustd (0.0014), uteam (0.08884), uresol (0.000289) and in the five levels the values obtained in ucombined (0.3677, 0.7145, 1,3789, 9.7710 and 12.8455), uexpa (15, 14, 9, 20 and 2 %) these last values for being ≤ 30% the validation is accepted.
DISCUSSION
It is evident that the research carried out in the "AQLAB" laboratory to validate the electrothermal atomic absorption spectrometry method for determining Arsenic and Lead in water was based on the review of literature and methodologies previously used by other researchers. Through these references, recommended practices were applied, and acceptable results were obtained to validate the method. Some critical aspects related to securing linearity, precision, trueness and uncertainty calculation are highlighted below:
Linearity: Obtaining linearity is essential to establish the relationship between the analyte concentration and the absorbance signal. In this case, standards prepared automatically by the equipment were used, which minimizes possible preparation errors by the analysts. The high correlation coefficients (r²) of 0.998 for Arsenic and 0.999 for Lead indicate an excellent linear relationship between concentrations and absorbances, which supports the method's suitability. According to Perelonia17, if the obtained R 2 value is higher than 0.995, the analytical response is linear in certain concentration ranges13.
Analytical precision was calculated by evaluating the repeatability and reproducibility of the instrument response to the analyte. Repeatability refers to the precision under the same operating conditions (analysts and equipment) over a small time interval. Reproducibility expresses the accuracy of a method under different operational conditions. In addition, robustness was evaluated through reproducibility, as the technique was performed by different analysts17. The reproducibility analysis (R) shows that the calculated t (1.18714, 1.31162, 0.94981, 0.82099 and 1.67286) was < t - theoretical (2.22814) at all five levels, thus accepting the validation of the method. Y The precision analyses at the five levels show that the calculated F (1.39521, 1.70316, 0.89312, 0.66728 and 2.77049) is < tabulated F (4.96460), so the validation of the method is accepted. These values are below the values set by AOAC (2016)18 where an appropriate maximum value should not exceed 15%. Therefore, it can be stated that the proposed method showed a good according to the values obtained.
Trueness: The trueness calculation is essential to evaluate the ability of the method to accurately recover the proper concentration of the analyte in the samples. Considering 6 fortified samples for validation and complying with the established acceptance ranges (85% to 115%) ensures that the method is accurate and provides results close to the actual values of Arsenic and Lead in the samples. These values are within those established within the AOAC 2015 method19, where it is demonstrated that the recovery obtained during the validation of the method must be 100 ± 25%. Under this criterion, the elements analyzed showed a particularly good recovery20.
Uncertainty: The research by Sanmiguel and Guerrero21 provided the basis for calculating uncertainty using various statistical equations. These methodologies obtained uncertainty results within the acceptance range (u < 30%). This demonstrates that the "AQLAB" laboratory results are reliable and accurate, and a reasonable estimate of the uncertainty associated with the measurements is available.
CONCLUSIONS
The validation methods analyzed for the determination of metals (Lead and Arsenic) in water allowed the establishment that the ITE-AQLAB-96 method for the determination of Arsenic and lead in drinking, natural and wastewater with a range of 0.01 to 0.20 mg/L for As and 0.005 to 0.10 mg/L for Pb and an in-certainty of 15% As and 20% Pb.
Overall, the "AQLAB" laboratory work demonstrates a solid research and validation methodology for the electrothermal atomic absorption spectrometry method used to determine arsenic and lead levels in water. The results obtained and their comparison with the cited references support the quality and reliability of the data generated in the laboratory.
Author Contributions: Conceptualization, T.V-T., S.A-B., R.T-T.; methodology, TV-T., A.M-L S.A-B. and R.T-T.; statistical analysis, T.V.-T., S.A-B., R.T-T.; writing-original draft preparation, T.V.-T. V.M-L., writing-review and editing, T.V.-T., M.M-L, L.S-T. and V.L.-V. All authors have read and agreed to the published version of the manuscript.
Funding:To the AQLAB Laboratory.
Institutional Review Board Statement:Does not apply.
Informed Consent Statement:Does not apply.
Data Availability Statement:The data is contained in the article.
Acknowledgments:Ing. Armando Meléndrez - Director of AQLAB, for allowing the students to conduct this study.
Conflicts of Interest:The authors declare no conflict of interest.
REFERENCES
1. Hill SJ, Fisher AS. Atomic Absorption, Methods and Instrumentation. En: Lindon JC, Tranter GE, Koppenaal DW, editores. Encyclopedia of Spectroscopy and Spectrometry (Third Edition) [Internet]. Oxford: Academic Press; 2017 [citado 24 de julio de 2023]. p. 37-43. Disponible en: https://www.sciencedirect.com/science/article/pii/B9780128032244000996
2. Gallegos W, Vega M, Noriega P. Espectroscopía de absorción atómica con llama y su aplicación para la determinación de plomo y control de productos cosméticos. La Granja. 30 de junio de 2012;15(1):19.
3. Makarishcheva DD, Kolesnikova ON, Tregubova VE, Ustinnikova OB. Development of a Quantitative Determination Method for Aluminum Ions in Adsorbed Drugs Using Atomic Absorption Spectrometry with Electrothermal Atomization. Pharm Chem J. 2022;56(4):527-31.
4. Rada-Mendoza M del P, Villamiel-Guerra M del M, Hoyos-Saavedra OL, Alvira LF. Quantification of Lead using atomic absorption spectrometry in thermoformed and biodegradable flexible films made from cassava (Manihot esculenta crantz). DYNA. 2018;85(207):236-42.
5. Dias VMC, Cardoso ASB. The determination of Lead in sugar and sweets without digestion by electrothermal atomic absorption spectrometry (ETAAS) with a rhodium chemical modifier. Food Addit Contam. mayo de 2006;23(5):479-83.
6. Ohta K. Electrothermal atomic-absorption spectrometry of Arsenic and its application to environmental samples. Talanta. marzo de 1978;25(3):160-2.
7. Fawkes L, Sansom G. Preliminary Study of Lead-Contaminated Drinking Water in Public Parks—An Assessment of Equity and Exposure Risks in Two Texas Communities. Int J Environ Res Public Health. 14 de junio de 2021;18(12):6443.
8. Khaksar Fasaee MA, Pesantez J, Pieper KJ, Ling E, Benham B, Edwards M, et al. Developing early warning systems to predict water lead levels in tap water for private systems. Water Res. 1 de agosto de 2022;221:118787.
9. Lu W, Levin R, Schwartz J. Lead contamination of public drinking water and academic achievements among children in Massachusetts: a panel study. BMC Public Health. 15 de enero de 2022;22(1):107.
10. Aderibigbe AD, Stewart AG, Hursthouse AS. Seeking evidence of multidisciplinarity in environmental geochemistry and health: an analysis of Arsenic in drinking water research. Environ Geochem Health. 1 de febrero de 2018;40(1):395-413.
11. Stetson SJ, Lawrence C, Whitcomb S, Kanagy C. Determination of four arsenic species in environmental water samples by liquid chromatography- inductively coupled plasma - tandem mass spectrometry. MethodsX. 1 de enero de 2021;8:101183.
12. Alidadi H, Ramezani A, Davodi M, Peiravi R, Paydar M, Dolatabadi M, et al. Determination of Total Arsenic in Water Resources: A Case Study of Rivash in Kashmar City. Health Scope [Internet]. 2015 [citado 28 de julio de 2023];4(3). Disponible en: https://brieflands.com/articles/healthscope-20125.html#abstract
13. Komorowicz I, Barałkiewicz D. Determination of total Arsenic and arsenic species in drinking water, surface water, wastewater, and snow from Wielkopolska, Kujawy-Pomerania, and Lower Silesia provinces, Poland. Environ Monit Assess. 2016;188(9):504.
14. Servicio de Acreditación Ecuatoriano. Plan Institucional SAE – Servicio de Acreditación Ecuatoriano [Internet]. 2022 [citado 27 de julio de 2023]. Disponible en: https://www.acreditacion.gob.ec/plan-estrategico-institucional-sae/
15. Magnusson B, Örnemark U. Validacion Eurachem - Guía internacional de validación de métodos analíticos - Warning: TT: - Studocu [Internet]. 2014 [citado 27 de julio de 2023]. Disponible en: https://www.studocu.com/es-mx/document/universidad-de-celaya/quimica-analitica/validacion-eurachem-guia-internacional-de-validacion-de-metodos-analiticos/9164386
16. AQLAB. Blogs. 2020. Laboratorios de Análisis y Evaluación Ambiental. Disponible en: https://www.aqlabec.com/index.html
17. Perelonia KBS, Benitez KCD, Banicod RJS, Tadifa GC, Cambia FD, Montojo UM. Validation of an analytical method for the determination of cadmium, Lead and mercury in fish and fishery resources by graphite furnace and Cold Vapor Atomic Absorption Spectrometry. Food Control.2021;130:108363.
18. AOAC Official Method 2016.01: Heavy Metals in Food; AOAC: Arlington, USA, 2016.
19. AOAC Official Method 2015.01: Heavy Metals in Food; AOAC: Arlington, USA, 2015.
20. Garzón DA, Ahumada DA, Gamba JPA, Ágreda J, Castillo E. Quantification of Arsenic, Cadmium, Mercury and Lead in Pineapple: Method Development, Validation and Evaluation of In-House Reference Materials. J Braz Chem Soc.2020;31:1296-305.
21. Sanmiguel Torres JX, Guerrero Carrera SR. Validación del método para determinar Pb, Cd, Ni por espectrometría de absorción atómica de llama en agua y suelo. [Internet] [bachelorThesis]. Escuela Superior Politécnica de Chimborazo; 2017 [citado 28 de julio de 2023]. Disponible en: http://dspace.espoch.edu.ec/handle/123456789/7019
Received: 9 October 2023/ Accepted: 15 January 2024 / Published:15 February 2024
Citation. Vargas-Tierras T, Morales-León V, Andi-Barrera S, Toapanta-Topón R, Morales-León M, Segovia-Tello L, Lara-Villegas V. Detection of arsenic and lead ions in water through validation of the electrothermal atomic absorption method. Revis Bionatura 2024; 1 (1) 8. http://dx.doi.org/10.21931/BJ/2024.01.01.8
Additional information Correspondence should be addressed to tannia.vargas@espoch.edu.ec
Peer review information. Bionatura thanks anonymous reviewer(s) for their contribution to the peer review of this work using https://reviewerlocator.webofscience.com/
All articles published by Bionatura Journal are made freely and permanently accessible online immediately upon publication, without subscription charges or registration barriers.
Publisher's Note: Bionatura stays neutral concerning jurisdictional claims in published maps and institutional affiliations.
Copyright: © 2024 by the authors. They were submitted for possible open-access publication under the terms and conditions of the Creative Commons Attribution (CC BY) license (https://creativecommons.org/licenses/by/4.0/).